


Google Analytics eCommerce: The Ultimate Step by Step Guide
Published By Nick Dimitriou
September 19, 2018

19/09/18
Let’s assume you’ve just started your own eCommerce store; wouldn’t it be a shame if you didn’t track all the valuable statistics an e-shop needs?
From the number of visitors you get to the shopping behavior of your customers, Google Analytics for eCommerce is a must-have marketing weapon for your arsenal.
Using this data you’ll be able to track the performance of your eCommerce store, as well as to measure whether your marketing strategies are spot-on or shooting in the dark.
Google Analytics for eCommerce will allow you to monitor, iterate those strategies and, ultimately, increase the ROI for your e-shop.
BONUS: Get our Quick Installation Guide!
Try Moosend Today
The easiest and most affordable email marketing and newsletter software!
How to Create a Google Analytics Account
First things first, to use Google Analytics for eCommerce you’ll need to set up a Google Account.
You might already have one, but even if you don’t I am going to quickly show you how to do just that, just in case.
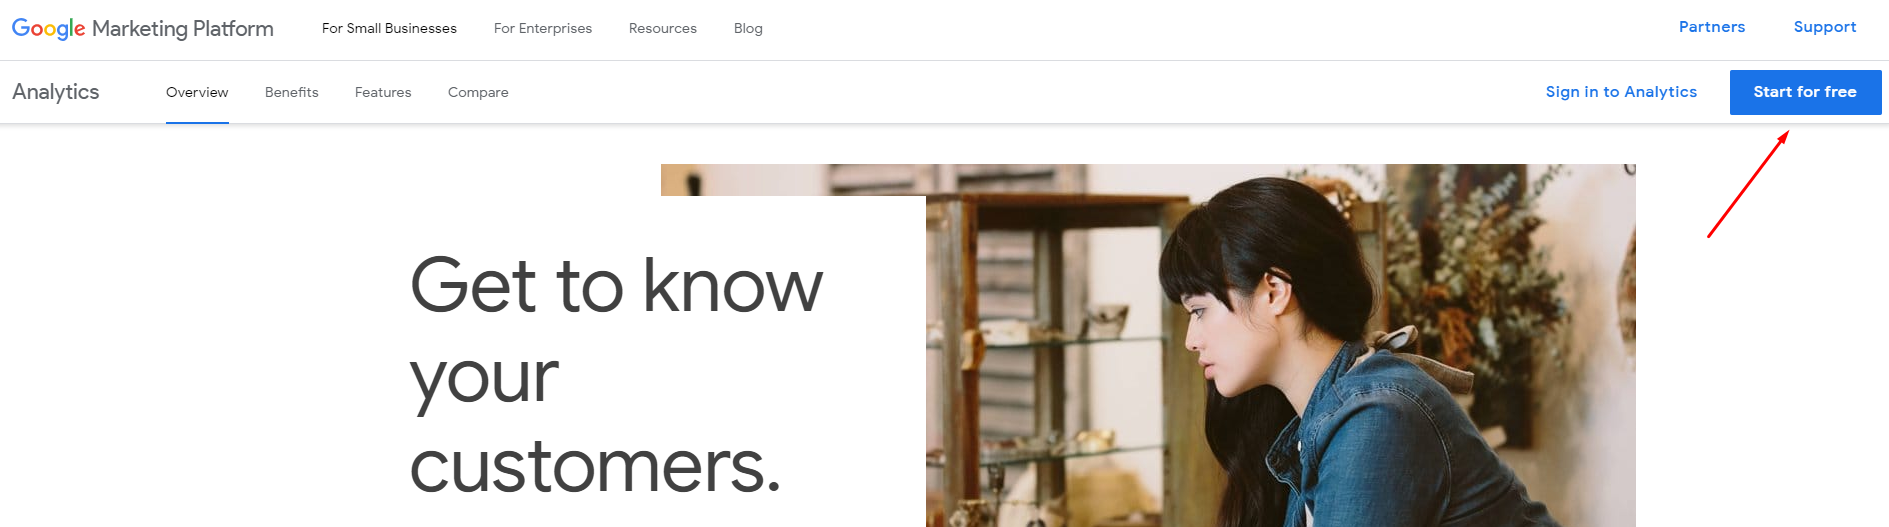
Start by clicking the link here.
Click on the Start For Free button.
Create or sign in with your GMAIL Account.
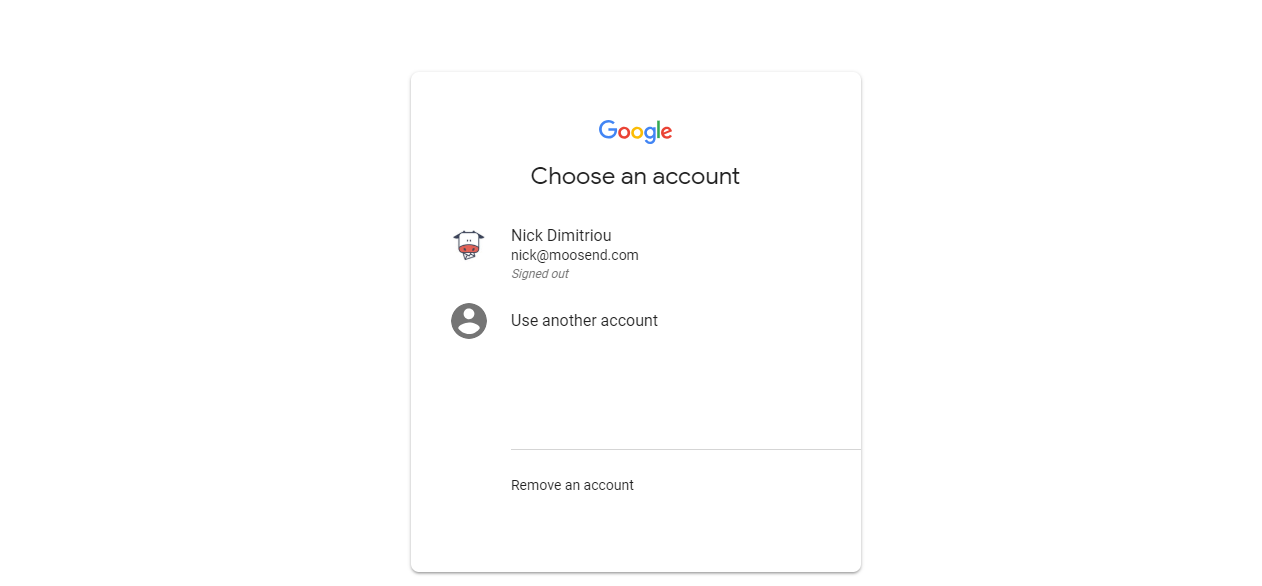
After signing in you will be greeted by the following screen.
Here, you’ll need to enter your eCommerce store info.
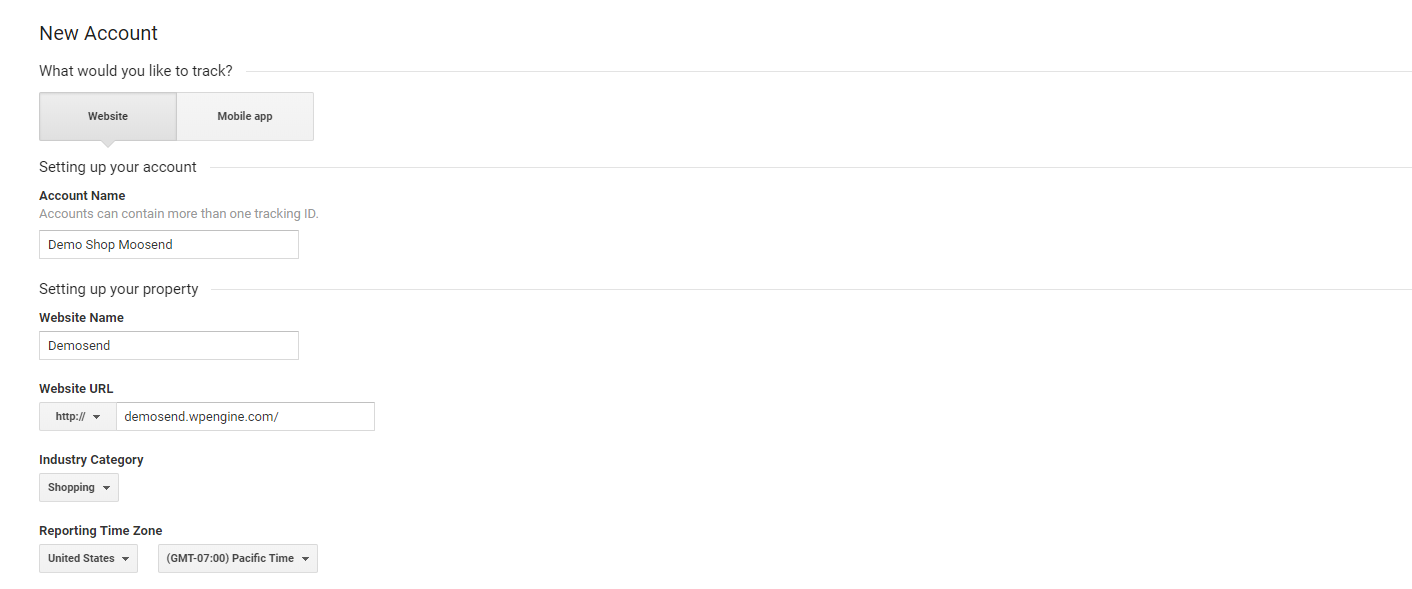
After you’ve filled in all the required fields scroll to the bottom and click on Get Tracking Code.

Your tracking ID and the tracking code will be shown on your screen like so:
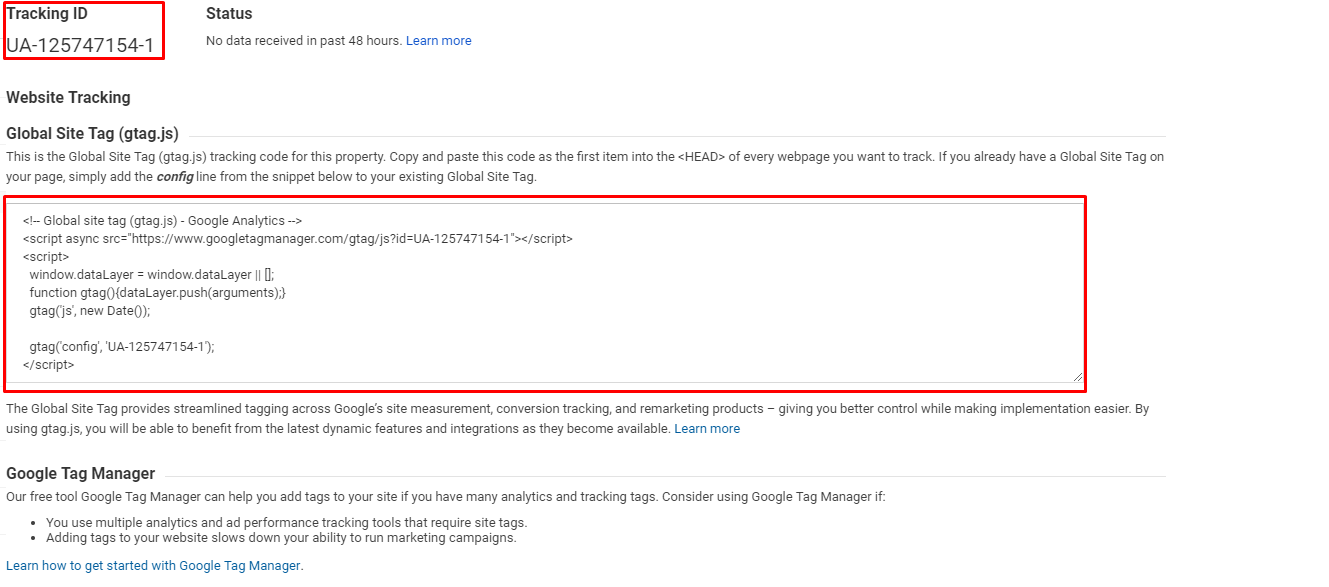
So far so good? Cool!
Time to add your Google Analytics code to your store.
How to Add The Tracking Code To Your eCommerce Store
Now you need to insert that particular script into your eCommerce store.
To make your life much easier, you can use Head and Footer Script Inserter which is one of the best WordPress Plugins to use, if you don’t want to mingle with the WordPress Code Editor.
Install the aforementioned plugin and enter the tracking code to the head tag and click Save.
![]()
Depending on which shopping cart provider you are using, this process might be slightly different.
For example, Shopify allows you to simply enter the tracking code directly through their settings.
Woocommerce, on the other hand, has a dedicated plugin to integrate Google Analytics into your eCommerce store.
Using a native Woocommerce plugin is the best way to prevent transaction discrepancies in Google Analytics so this should be your first option when installing eCommerce tracking on a Woocommerce based eCommerce store
How to Enable eCommerce Tracking
Now that you’ve added the tracking code to your e-shop it’s time to enable e-commerce tracking.
To do that, simply head over to the Admin setting.
On the View tab, search for eCommerce settings.
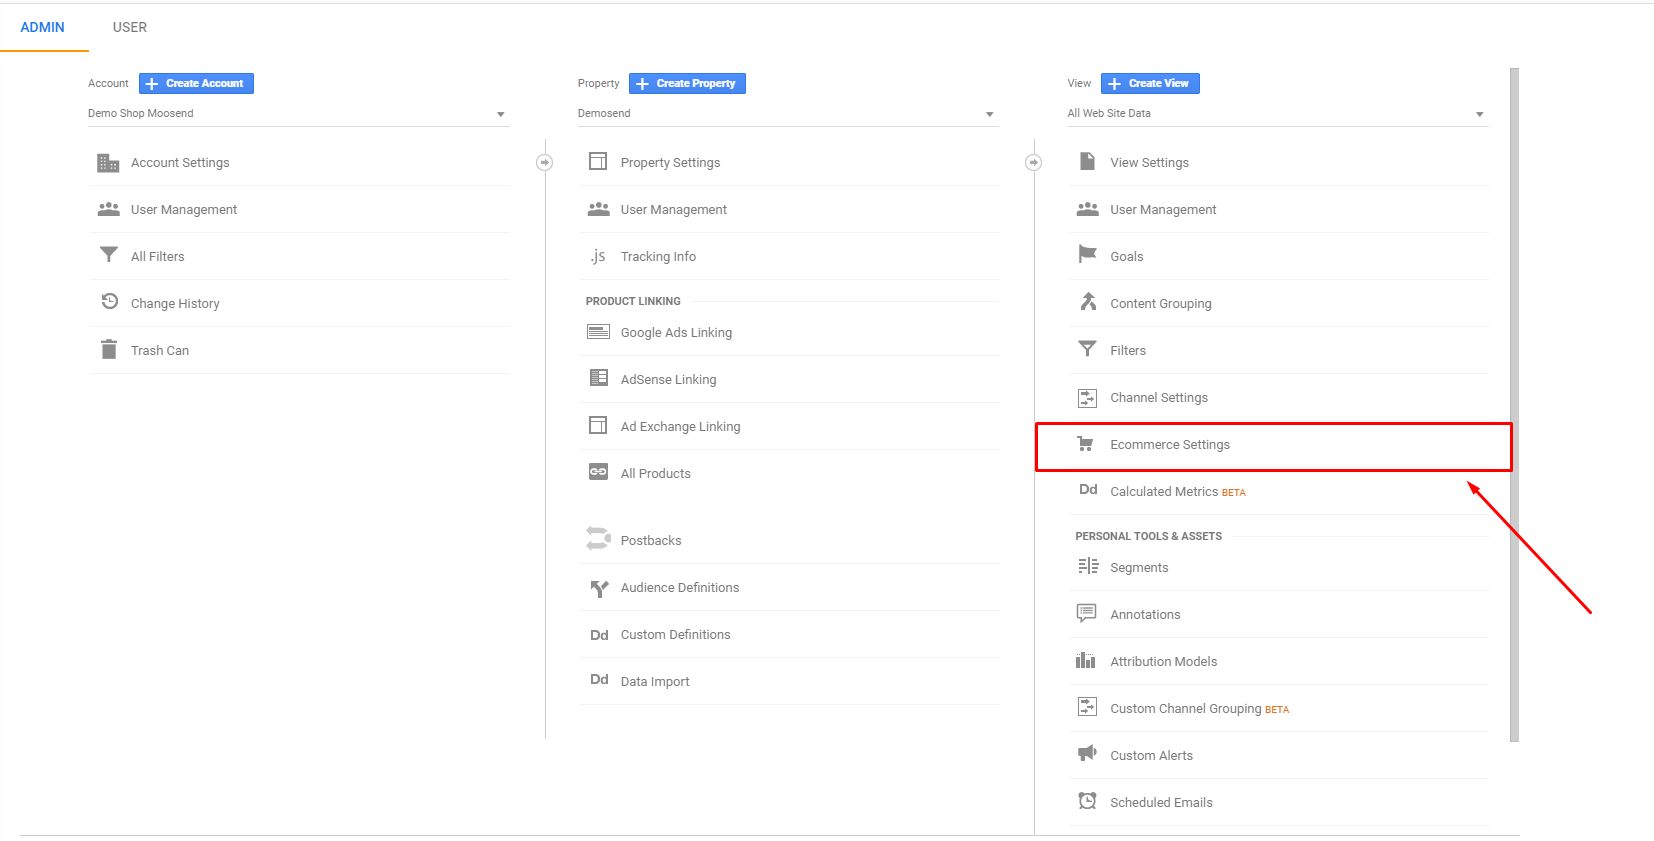
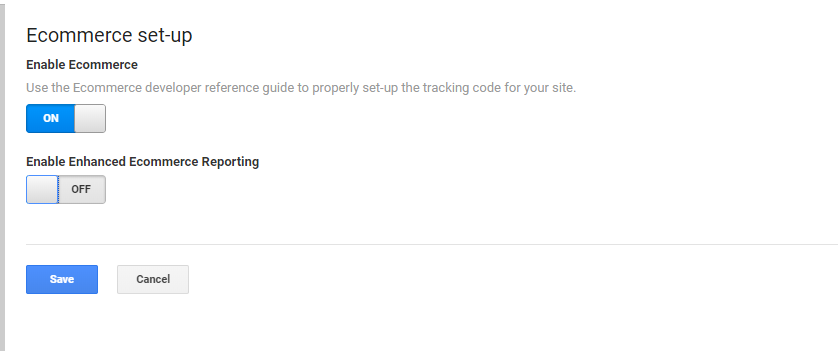
Click on eCommerce settings and enable Google Analytics eCommerce. Click Save.
Extra: If you are curious about Enhanced eCommerce Reporting to make sure to keep reading! You can also activate it right now to save some time later on.
For this particular article and since I am building a demo eCommerce store as we speak, I am going to use WooCommerce to demonstrate how to set up Google Analytics.
You can also follow our WooCommerce Tutorial to build your own eCommerce store!
Depending on your shopping cart the process will be different.
Let’s dive right into it, shall we?
Firstly, you’ll need to install the WooCommerce extension for Google Analytics.
To do that go to Plugins -> Add New -> Search for Google Analytics WooCommerce and install this plugin.
After installing the Google Analytics Integration for WooCommerce you’ll need to sync this with your Google Analytics Account.
Go to WooCommerce -> Settings -> Integrations
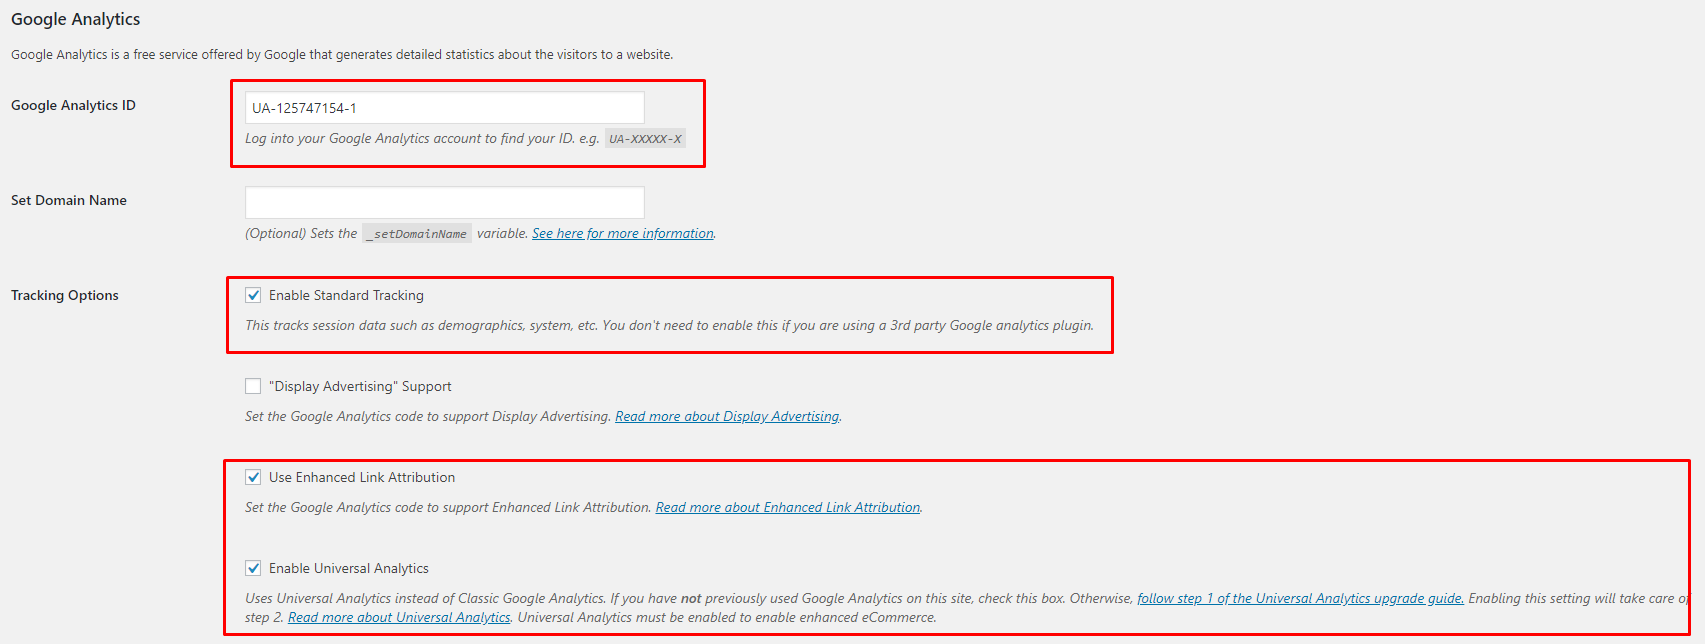
Then, fill and enable the settings:
- Google Analytics ID
- Enable Standard Tracking
- Use Enhanced Link Attribution
To locate your Analytics ID – if you’ve already forgotten:
- Log in to your Google Analytics Account
- Go to Admin dashboard
- Click on Property Settings in the Property tab
- Tada!
You will have to wait for 24 hours until WooCommerce and Google Analytics get synced.
In the meantime, you can activate Enhanced Google Analytics on the Google Analytics Admin Dashboard (if you haven’t already).
Remember to also activate it on the Google Analytics Integration Plugin for Woocommerce.
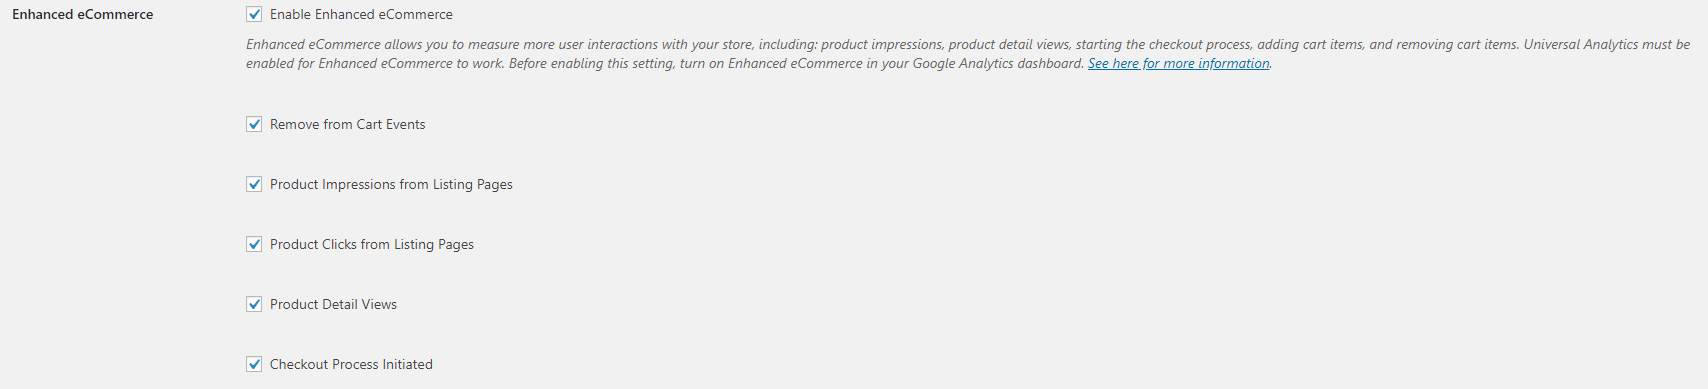
Make sure that all the enhanced/standard eCommerce settings are enabled.
How to Create a Google Tracking-enabled Thank You Page
Let’s start with a question.
Why do you need a Thank-You page?
For starters, your Thank-You page stands as a heartwarming message towards your customers. This message from their favorite store is always appreciated.
Therefore, it is more likely for your users to engage with a further call-to-action afterward, such as a discount voucher or a social share of their purchase.
However, the Thank-you page is also really important when it comes to tracking transactions, as it signifies that a transaction-specific action has taken place.
To simplify this process installing a WordPress plugin such as WooCommerce Thank you Page – NextMove Lite will allow you to create custom thank you pages that fit perfectly to your WooCommerce store.
Now, you’ll need to enable Google Analytics Tracking through the plugin. Go to Plugin Settings and at the bottom, you can see all the relevant settings:
![]()
This is making the process so much easier and you will not have to mingle with coding.
Click Save and we are almost there.
How to Configure GTM for Google Analytics eCommerce
What is GTM?
Google Tag Manager or GTM is another service provided by Google that allows you to manage various HTML and Javascript tags.
Remember when we used the Head and Footer Inserter Plugin?
It’s similar to that plugin although it’s ten times(or more) complex.
To get started you will need to set up a GTM Account.
The process is the same as setting up a Google Analytics Account.
To install GTM, use the Head and Footer Plugin we used earlier to insert the script on the Head tag.
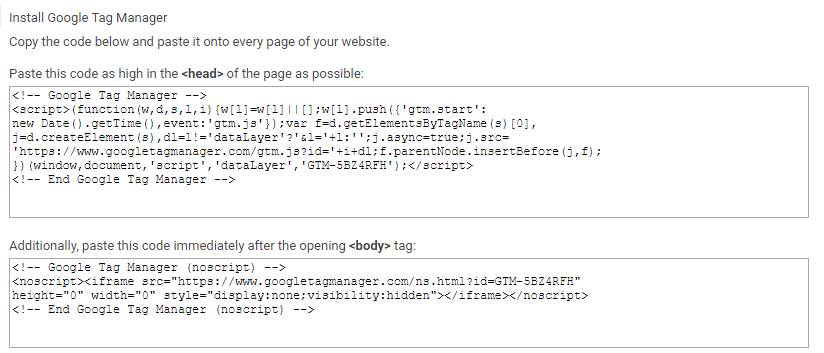
And for the second part, you’ll need to do some digging into the WordPress Editor and find the body tag within the header file.
Now we are going to use GTM to set up a Tag with a trigger to the Thank You page we created earlier.
This trigger is going to send all the relevant eCommerce statistics you need directly to your Google Analytics Dashboard.
Time to set this up.
Tag Configuration
Login to GTM if you are not already exploring it.
Click on Tags.
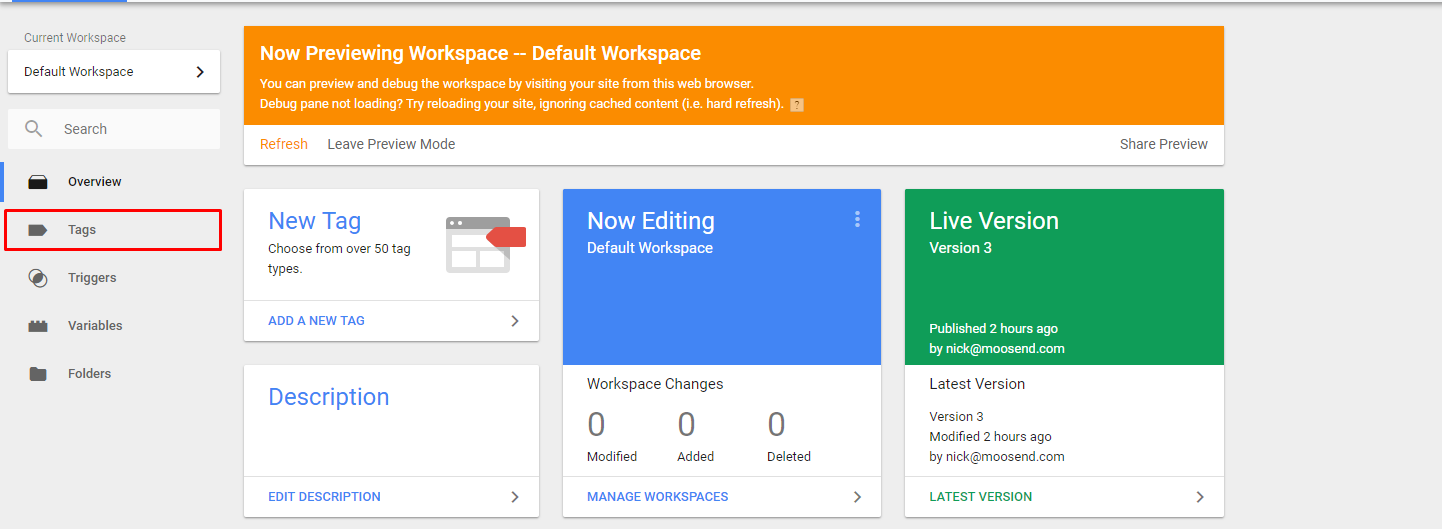
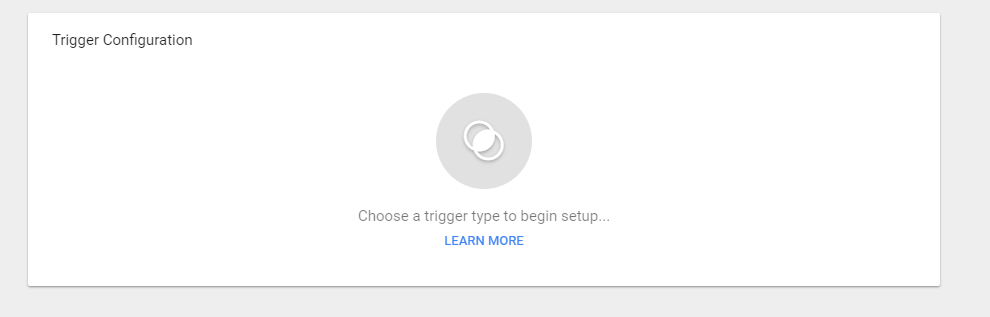
The following screen is going to appear where you’ll be able to configure Tag settings.
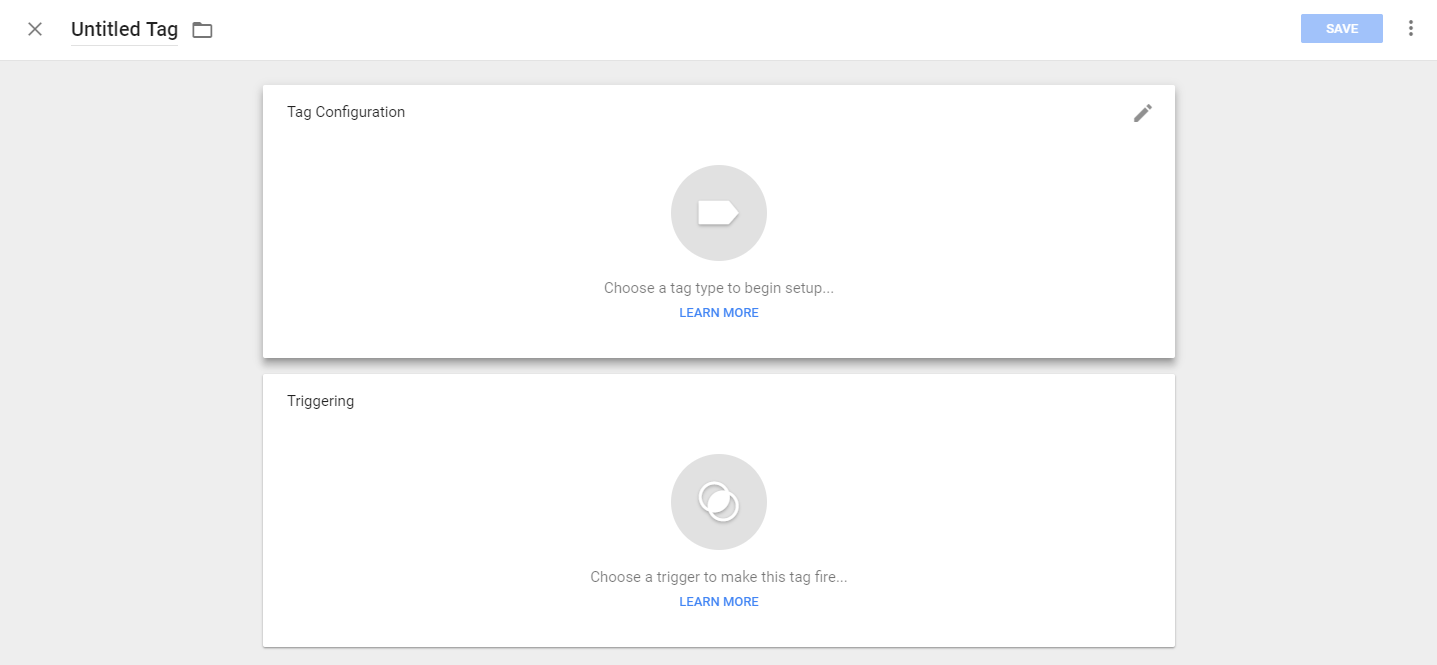
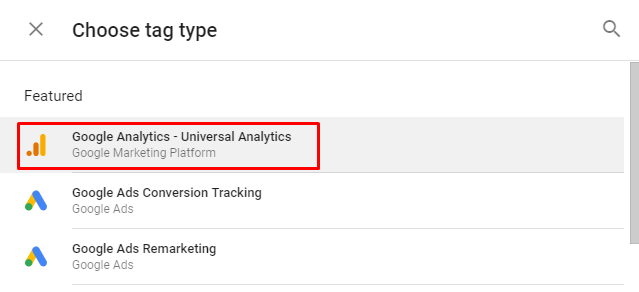
Click on Tag configuration and select Universal Analytics.
Now we’ll set up the Track Type and add our Tracking ID to see in real-time which pages our Tags are present on.
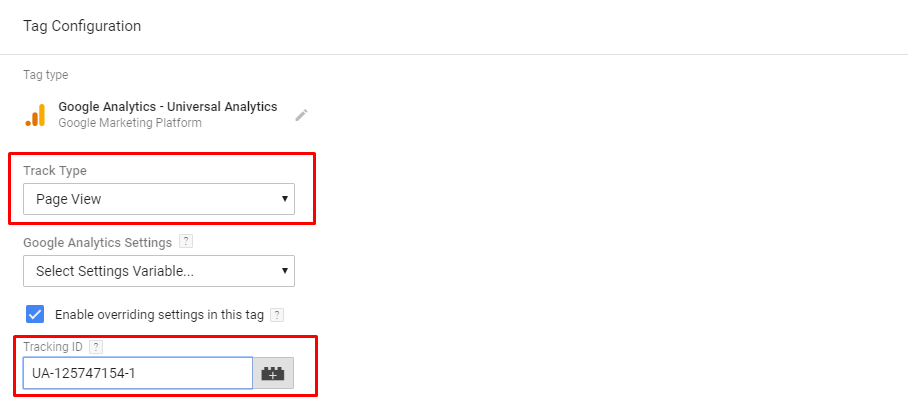
Click save and we are done!
Trigger Configuration
Now we’ll need to set up the trigger when one of our visitors completes an order and sees our thank you page; the details of that transaction are going to be sent to Google Analytics Dashboard.
Click on Triggers and select create a new trigger:
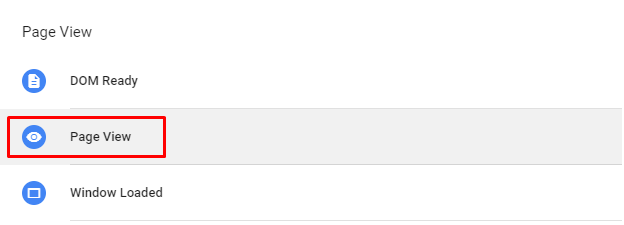
Select Page View as the trigger.
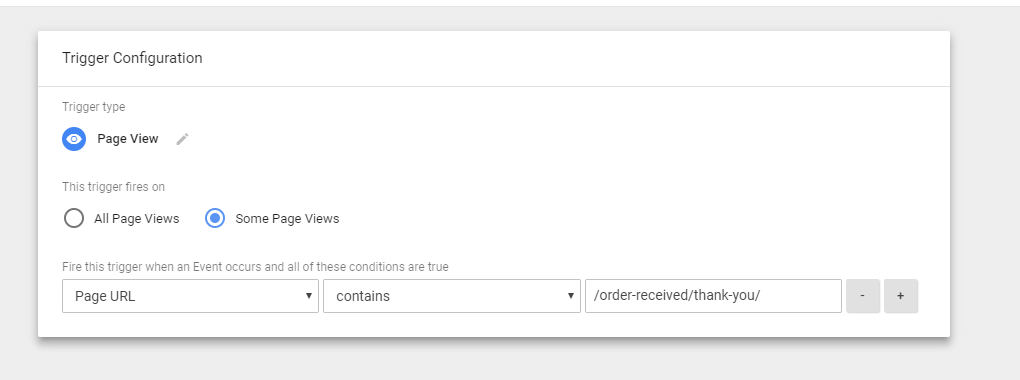
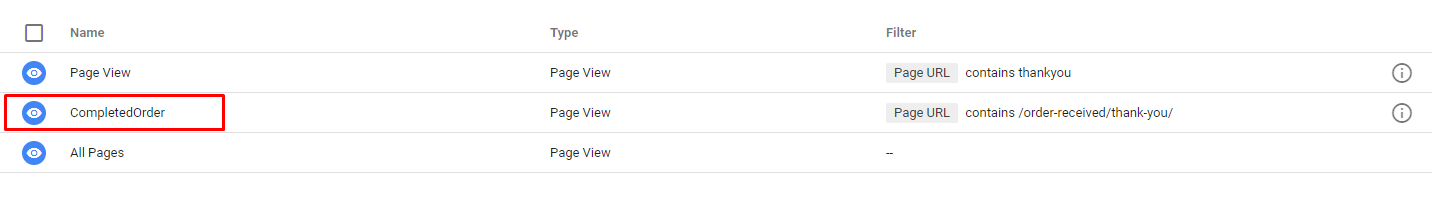
Configure the Page View trigger, to trigger when the Page URL contains the URL structure of your thank you page.
TIP: Make sure it contains the exact path, adding terms such as “thank you” “thank” may cause this trigger to fire on other pages with that same term.
Click Save and we are set!
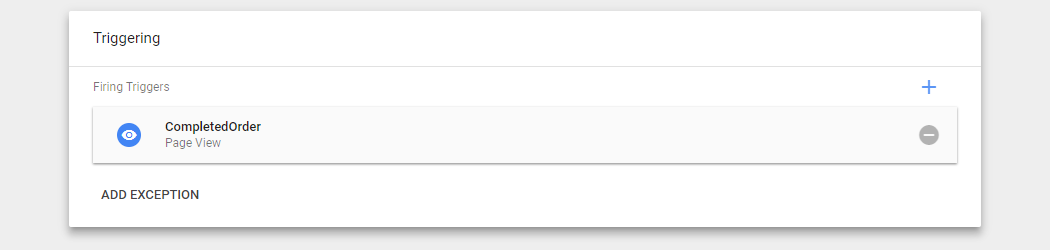
Time to link the Tag we created with the Trigger.
To do that go to Tags and select the Tag we created.
Click on Triggering.
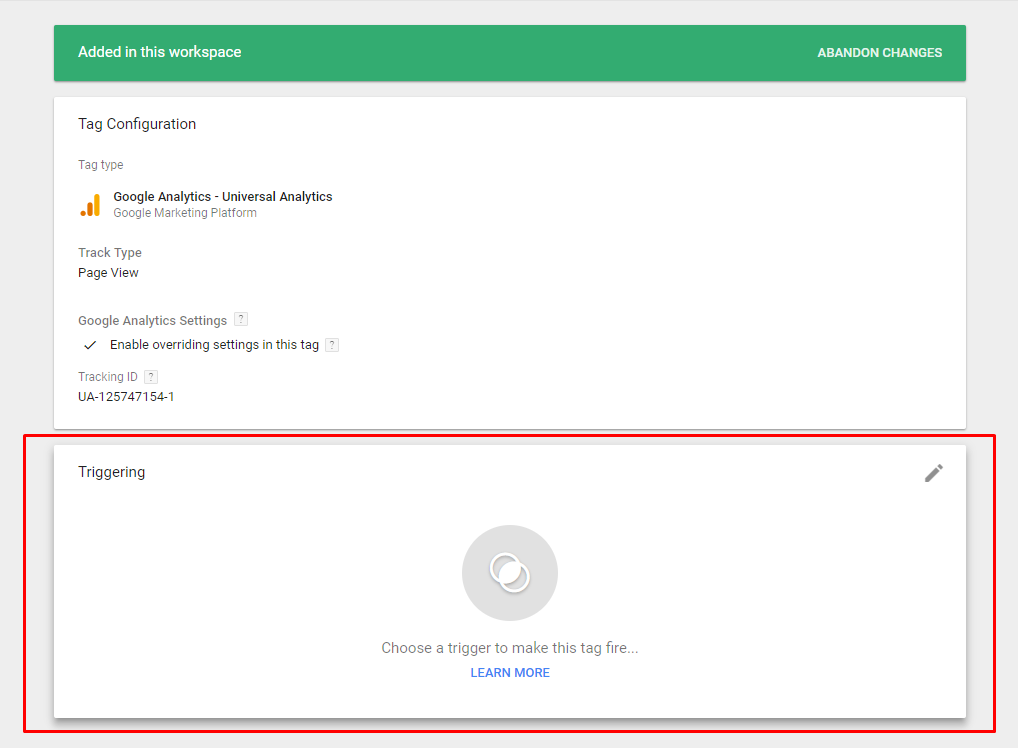
Select the trigger we created earlier.
 Like so.
Click Save and you are done!
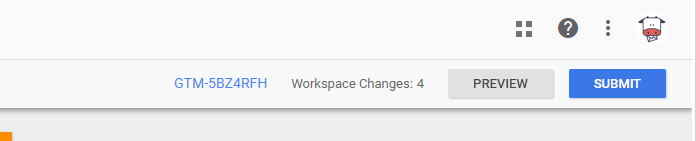
Now on the top right corner Hit Submit and Publish your newly made tag.
You might want to test this out and see if it works properly.
Google Tag Manager has an on-site real-time feature that allows you to see which tags are currently on the page as well as when one has been fired.
When you go to your website you will see this new window.
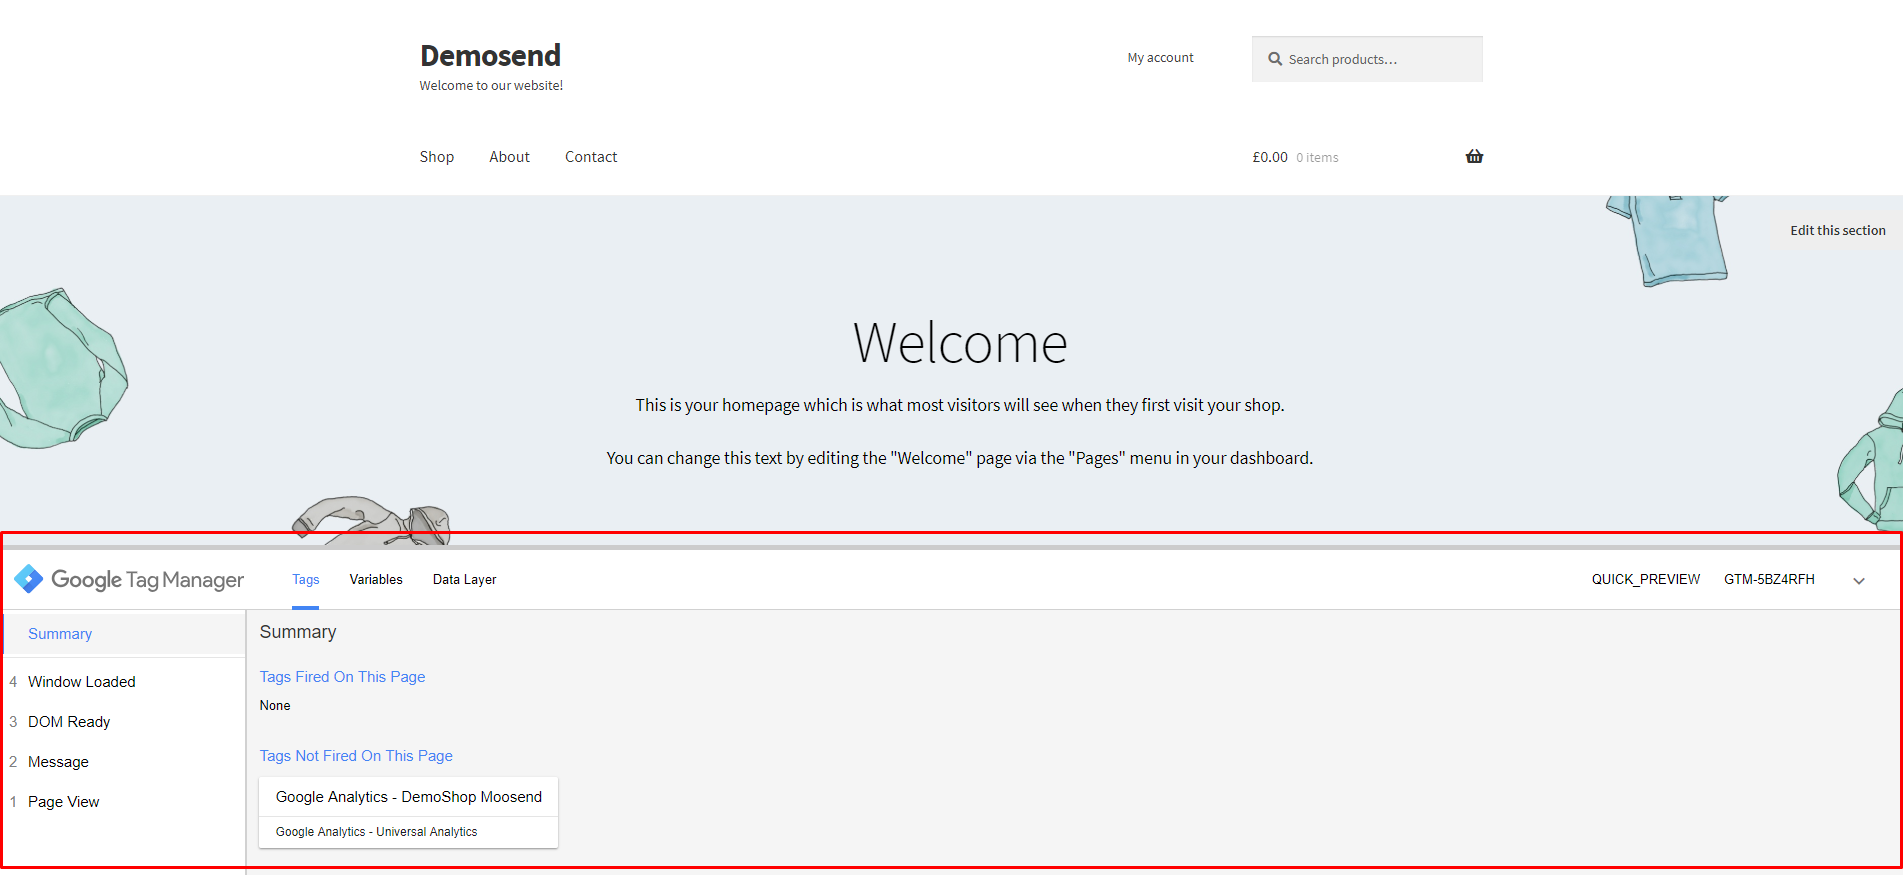
Let’s do a test run.
I am going to complete a test order and let’s see what GTM shows on the window.
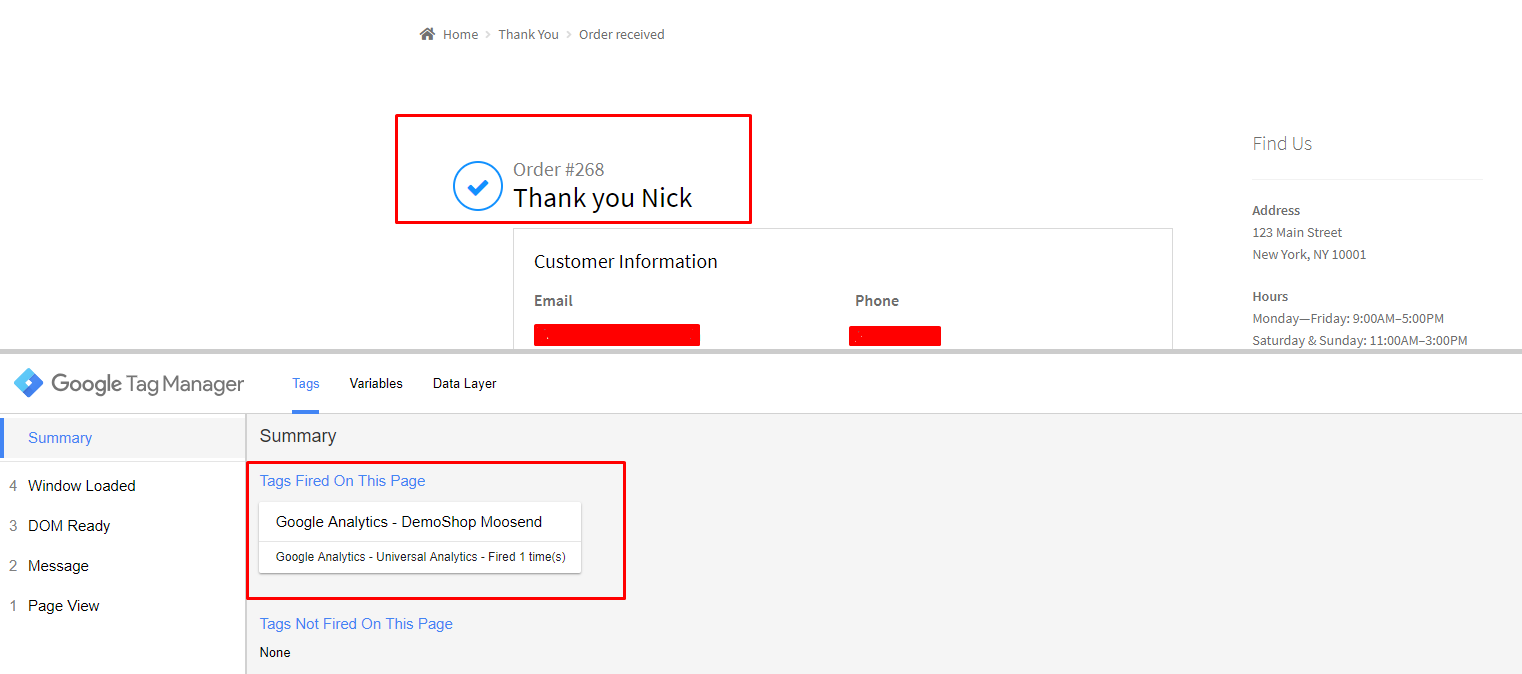
We are on the Thank you Page and GTM shows that the trigger has been fired.
Understanding Basic Google Analytics Reports
Now that all the Google Analytics scripts and settings are in place. It’s time to take a look at what you’ve eagerly been waiting for.
They might seem intimidating at first but bear no fear, as this is your way of understanding the performance of your business.
This will ultimately help you grow!
I know we’ve been discussing eCommerce stats so far but when it comes to reporting starting from all the basics first it is the best thing to do.
When you open Google Analytics on the left sidebar you will be able to select which type of reports you want to see.
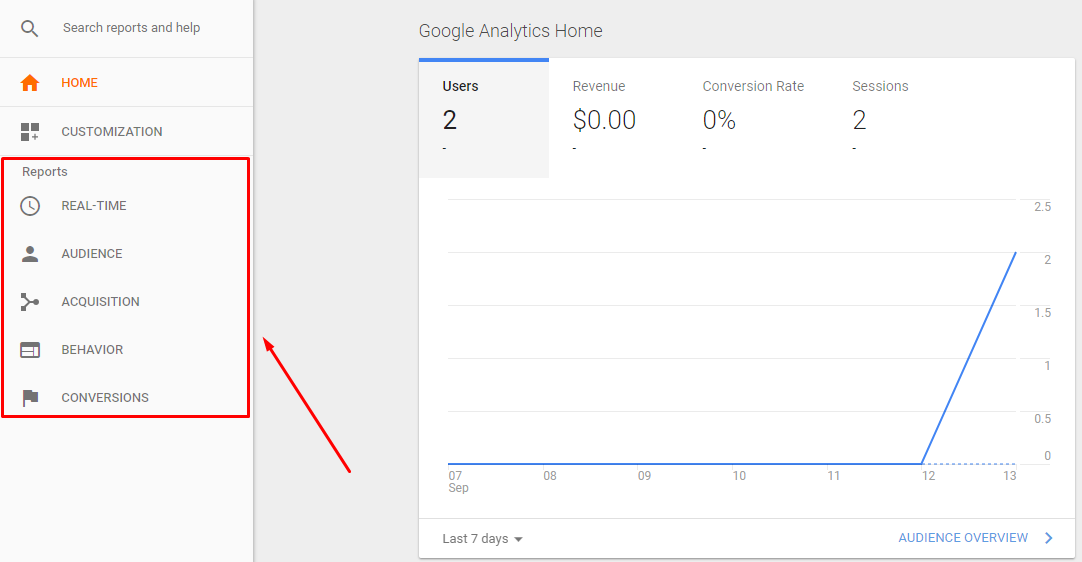
The available reports are Real-Time, Audience, Acquisition, Behaviour, and Conversions.
Each one serves a specific purpose so…
…let’s dive right into the graphs!
Real-Time Google Analytics Reporting
Google Analytics real-time reporting gives you the ability to track the activity of your website the moment it happens.
All of the actions taken within your website are being logged literally seconds after they occur, allowing you to understand how users interact with your site.
To access the Real-Time report sign in to your Google Analytics Account and on the sidebar menu click on REAL-TIME and then Overview.
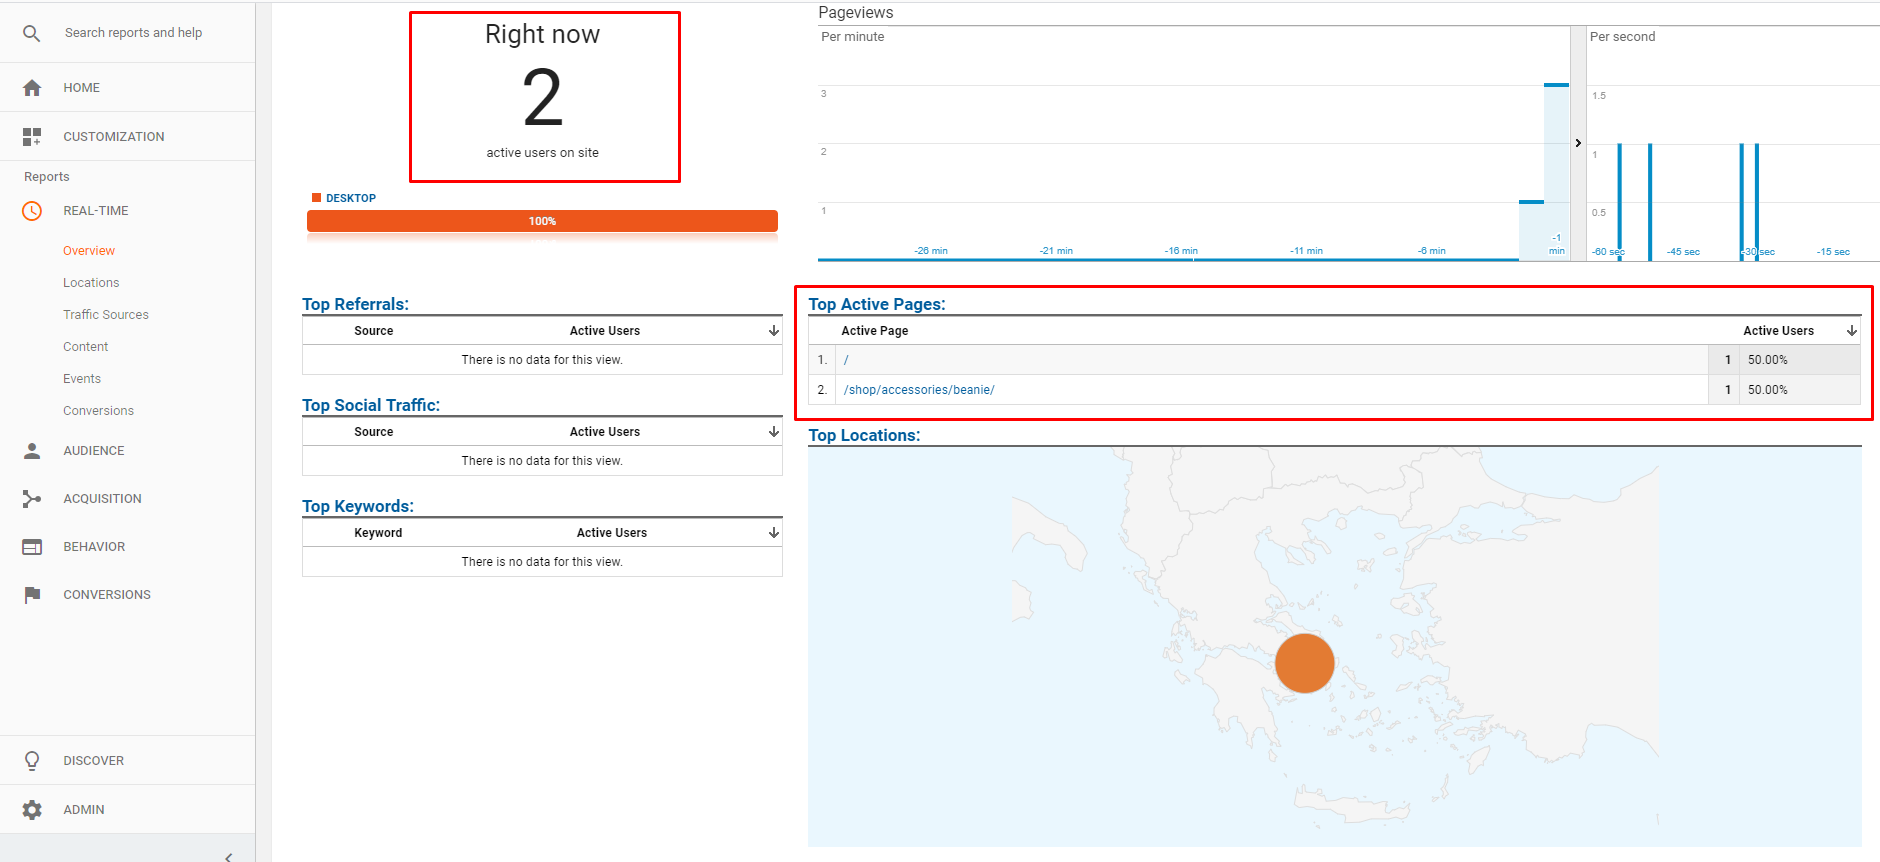
On the Overview tab, you’re able to monitor exactly how many people are on your website as well as what are they currently looking at.
As you can see in the screenshot above on the Top Active Pages we can clearly see that a user is hanging out on the homepage while another is checking out a product from our shop.
In addition to that, you can also take a look at the traffic that is currently being generated from referrals, socials, and the top keywords.
Through the sidebar menu, you can also view other real-time reports such as:
- Locations
- Sources
- Content
- Events
- Conversions
So besides checking how many people are currently on your site and where, what else can you do with the real-time report?
According to Google, you can use Real-Time report to:
- Track the performance of the new and changed content on your site
- Monitor mobile application with event tracking
- Analyze one-day promotions and how much traffic they are generating
- Monitor the effect social media posts have on your website
- Ensure that the Google Analytics Tracking Code works properly
- Track goal completions as you iterate your website (registrations)
Audience
The Audience report allows you to take a sneak peek at the attributes of your users.
These attributes might be their location, age, or even what type of browser/OS they are using.
Let’s take a look at that particular report by clicking on Audiences and then Overview.
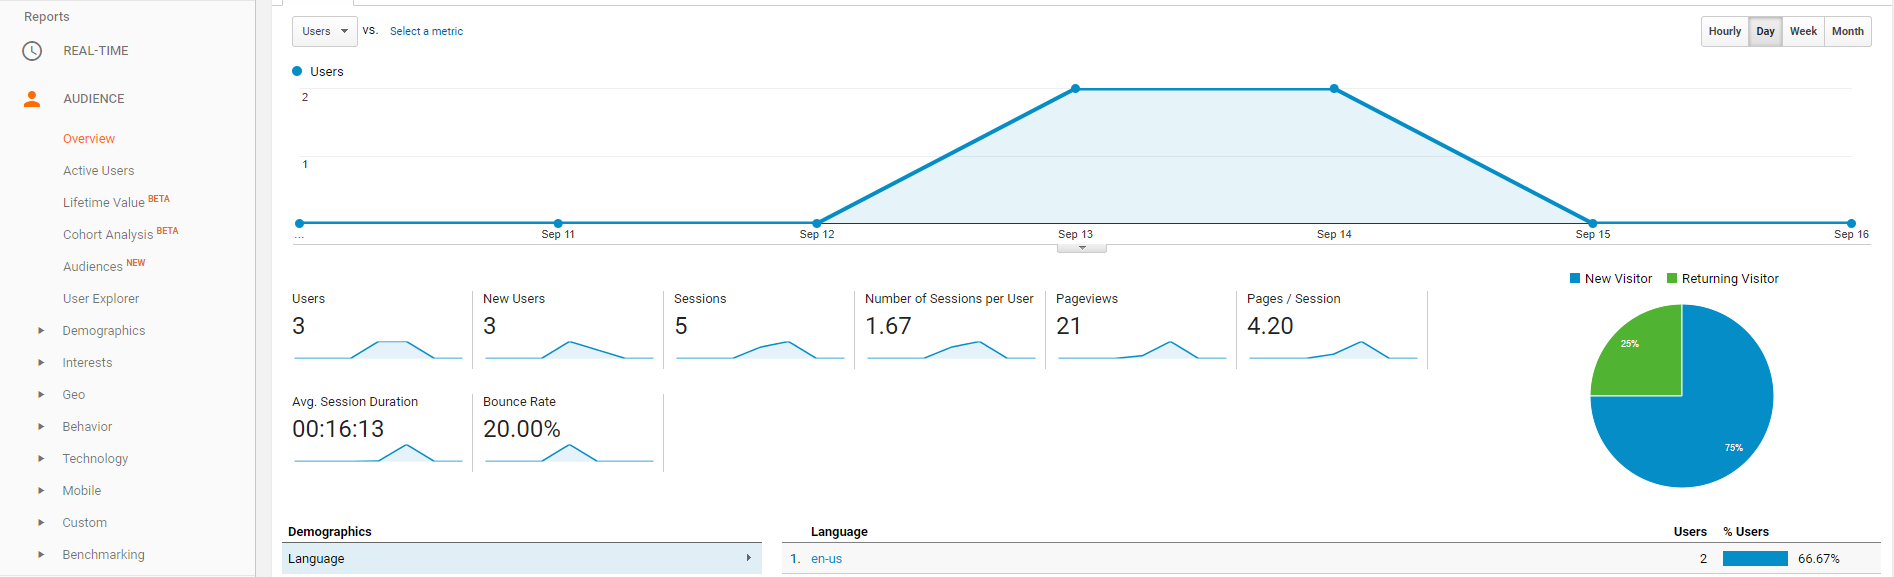
With a quick glimpse you can see a range of statistics available:
- Users
- New Users
- Sessions
- Sessions per User
- Page Views
- Pages per Session
- Average Session Duration
- Bounce Rate
In addition, you can see specific demographics and the language of the users that visit your website.
As you’ve probably noticed besides the overview report there are literally dozens of other sub-sections for you explore!
Active Users
On the Active Users section, you’re able to track user engagement with your website over specific time frames.
Lifetime Value (BETA)
Lifetime Value is one of the newest additions to Google Analytics Audience Report. This particular report provides you with an analysis of the revenue per user group after the acquisition.
The information acquired through the report can help you understand which marketing strategy works best for your business as well as to plan your marketing budget accordingly to increase conversions.
Cohort Analysis (BETA)
Cohort Analysis gives you the ability to put specific “cohorts” (groups of people with the same characteristics) under the microscope.
Analyze their behavior and ultimately optimize your website to increase user retention and conversions.
Audiences (BETA)
The Audiences report allows you to group specific users based on their unique characteristics and publish them to Analytics. This particular report is mainly used to analyze and monitor the performance of your marketing strategies.
Learn more on: Creating and Publishing Audiences
User Explorer
In contrast to the other reports User Explorer allows you to inspect the behavior of specific users.
This is done by tracking users either with an assigned by Google Analytics User-ID or Client-ID.
Other reports available through the Audience tab include:
- Demographics
- Interests
- Geo
- Behavior
- Technology
- Mobile
- Custom
- Benchmarking
- User Flow
Some interesting key uses for the above reports are:
- To identify potential markets you are not currently tapping into
- Optimize your website to enhance user experience and increase conversions
- Construct marketing strategies based on the behavior and attributes of your visitors
All this info might be a bit of a headache I know, take it slow and you’ll be on your way to extracting super valuable info to skyrocket your growth!
Acquisition
Every time I open Google Analytics my hand automatically goes and clicks on the Acquisition report.
It’s one of the most important reports as it allows you to scrutinize the process of how people actually found your website.
Keeping track of what type of sources drive traffic to your website gives you the ability to iterate your marketing strategies to achieve maximum exposure and increased revenue.
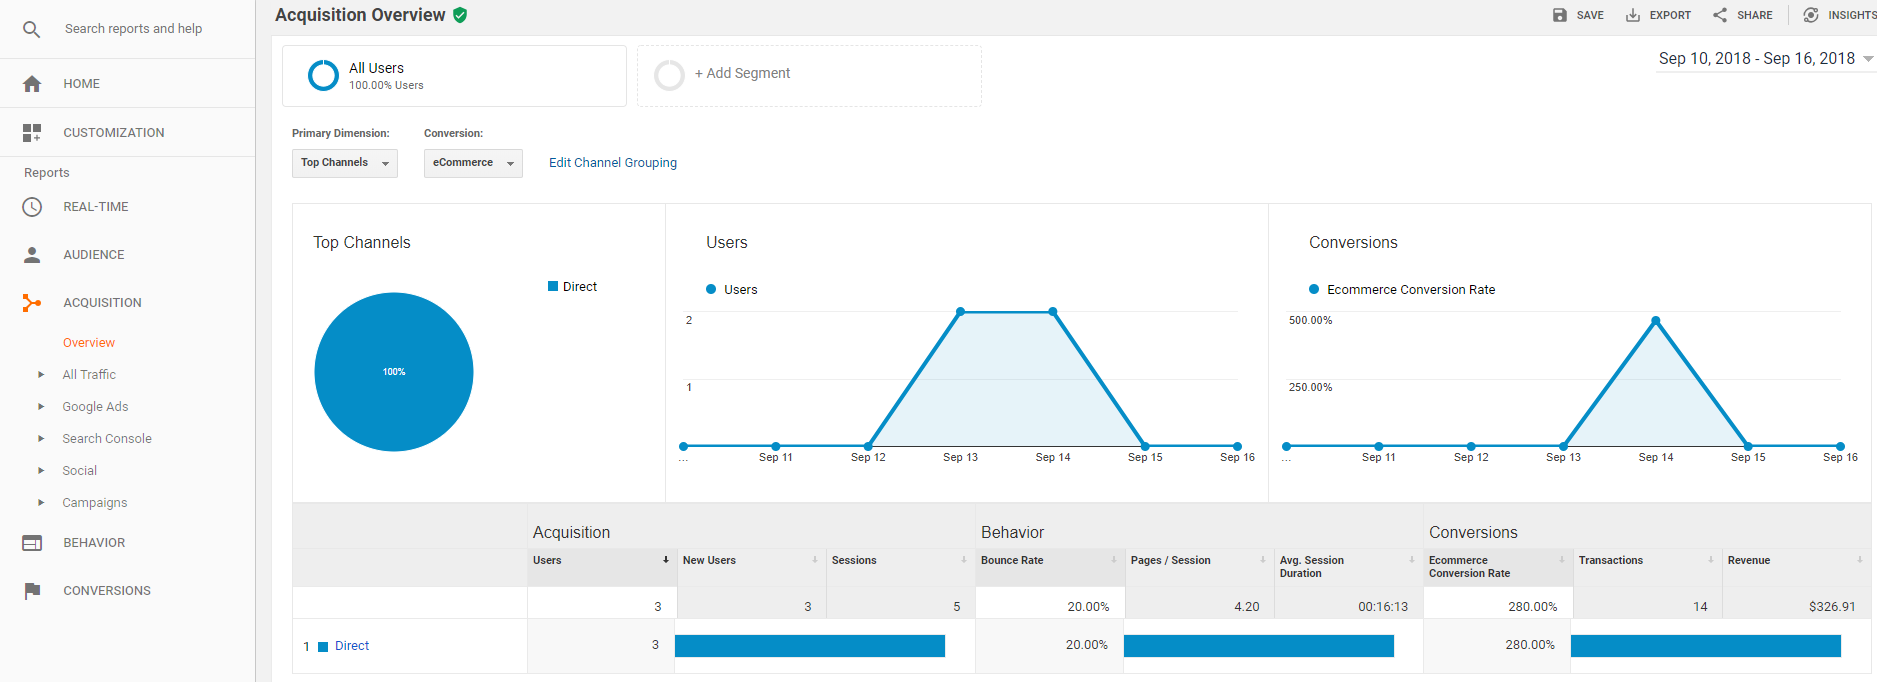
By clicking on the overview tab of the Acquisition report you’ll be able to take a quick look at the various channels that drive traffic to your website.
In addition, you are also able to see the revenue that has been produced through each channel.
The channels as set by Google Analytics are:
Direct Traffic
These channels refer to traffic that comes to your website and Google Analytics has no prior data for that particular source.
Therefore labeling it as Direct Traffic.
According to Moz Direct Traffic is GA’s fallback option when it cannot attribute a particular session to a source.
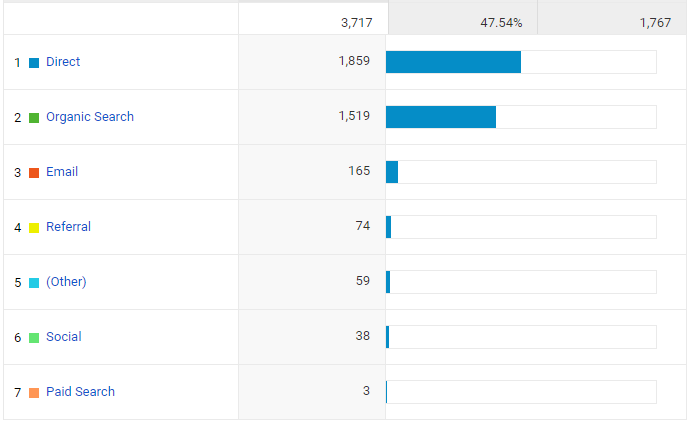
Organic Search
Organic Search as you probably already know, counts how many sessions have been established through the various search engines that exist.
Note: This does not only include Google, traffic from other search engines such as Bing and Yahoo will be credited under the Organic Search source.
As the name suggests, this channel shows you how many sessions have occurred through your email newsletter.
Referral
The referral channel is one of the most useful channels to monitor if you’re an SEO specialist or Link Building Master.
It provides you with how many sessions have been established through a particular link on the web.
For example, if a different website has linked to a page from your website you’ll be able to see how many visitors came through that particular website.
Looking for more SEO Tips read this helpful guide on SEO by ElevationB2B.
Tip: Super useful if you want to monitor the performance of your Guest Posting endeavors!
(Other)
The other channel shows you traffic that was generated based on a specific UTM you created.
UTM is a code formatting option that you enter into an URL to track its source, medium and campaign name.
To create a UTM you can use Google’s URL Builder for FREE!
Social
Account all the sessions that came directly through social networks such as Facebook, Twitter, and Reddit. (Not to bother them with other Social Analytics tools)
Paid Search
Provides insights as to how your Paid Advertising is performing. If you do PPC you’ll be able to monitor the performance of your ads through this channel.
The above reports are primarily used to:
- To monitor which channel brings the most traffic to your website
- Understand which channel produces more revenue for your business
- Identify potential revenue leaks from your visitor streams
- Act on those to enhance your marketing strategy
Behavior
As the name suggests the Behaviour report provides you with insights as to how your visitor engage with your website.
And if you own an eCommerce store you might want to pay a lot of attention to this section.
The report includes information on how many Page Views your website has generated as well as the Bounce and Exit Rate.

There are two main attributes that you should keep your eye on when skimming through the Behaviour report this is the Bounce Rate of your pages and the Site Speed subsection report.
The Bounce Rate
Allows you to identify pages that people visit and leave immediately without engaging with the content.
And if you find those pages and optimize them to become more appealing to your visitors the bounce rate will drop.
As a result of reducing the bounce rate, you might see an increase in your SEO rankings as well as increased conversions.
Tips for eCommerce Owner to Reduce Bounce Rates:
- Enhance Product Pages with Images
- A detailed explanation of Product(s) details and specifications
- Clear and Detailed Product Title
So as an eCommerce owner this report will be really helpful to identify product pages that have high bounce rates and optimize them.
Site Speed
When it comes to user experience site speed has a leading role and if your website loads fast your visitors will be happy, simple as that.
Through the report, you’ll be able to take a look at the average loading speed of your website, as well as various speed suggestions for your pages.
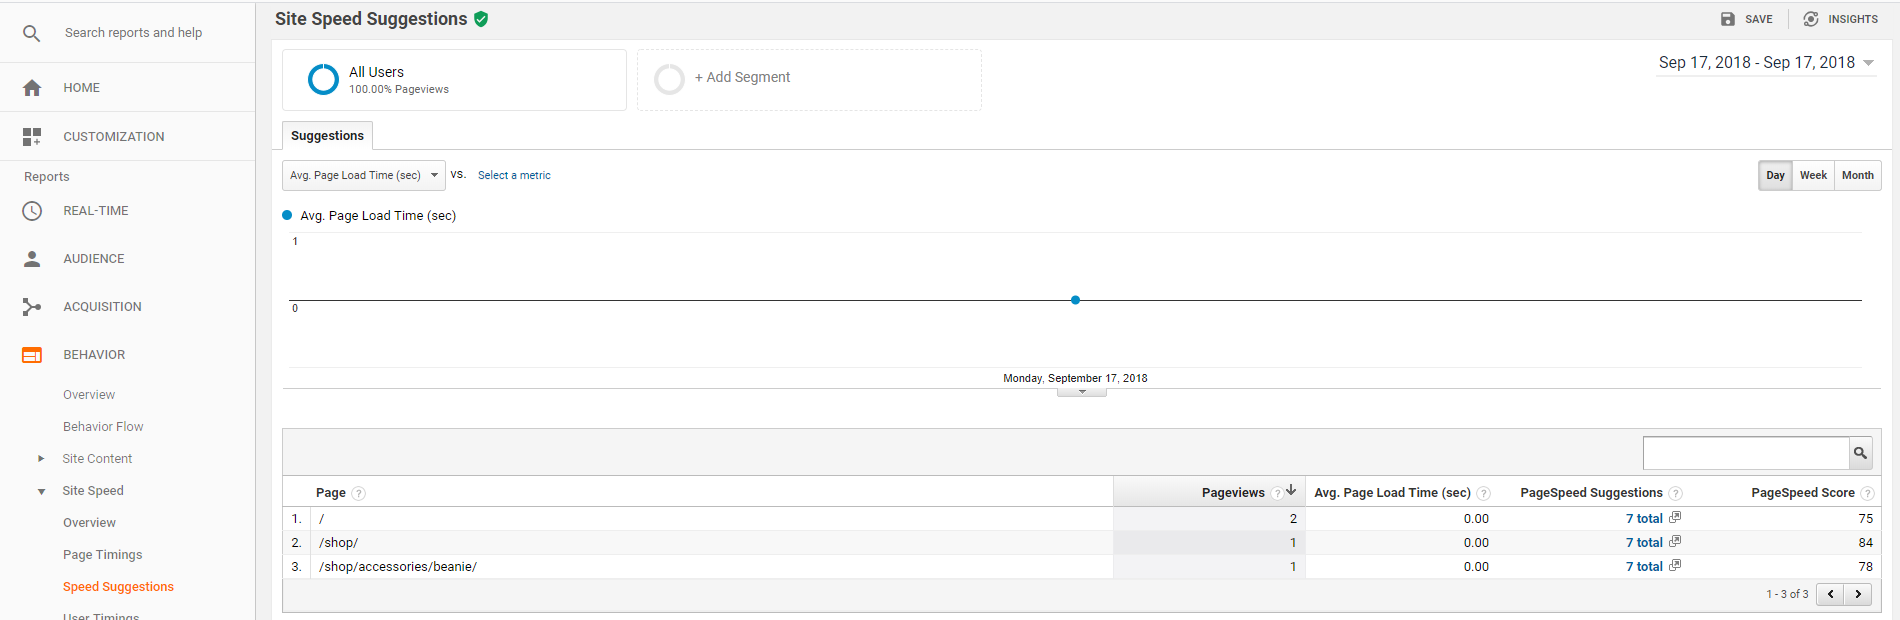
Some of the most common speed issues are large images or badly coded formatting.
Make sure to act on those issues as soon as possible because they can hold back your revenue and rankings!
Google Analytics Enhanced eCommerce Reporting
Now that you’ve read through all the Basic Reports it’s time to take a look at the eCommerce Reports available through the Conversions tab on the Google Analytics Dashboard.
The Conversions section is divided into four subsections, as follows.
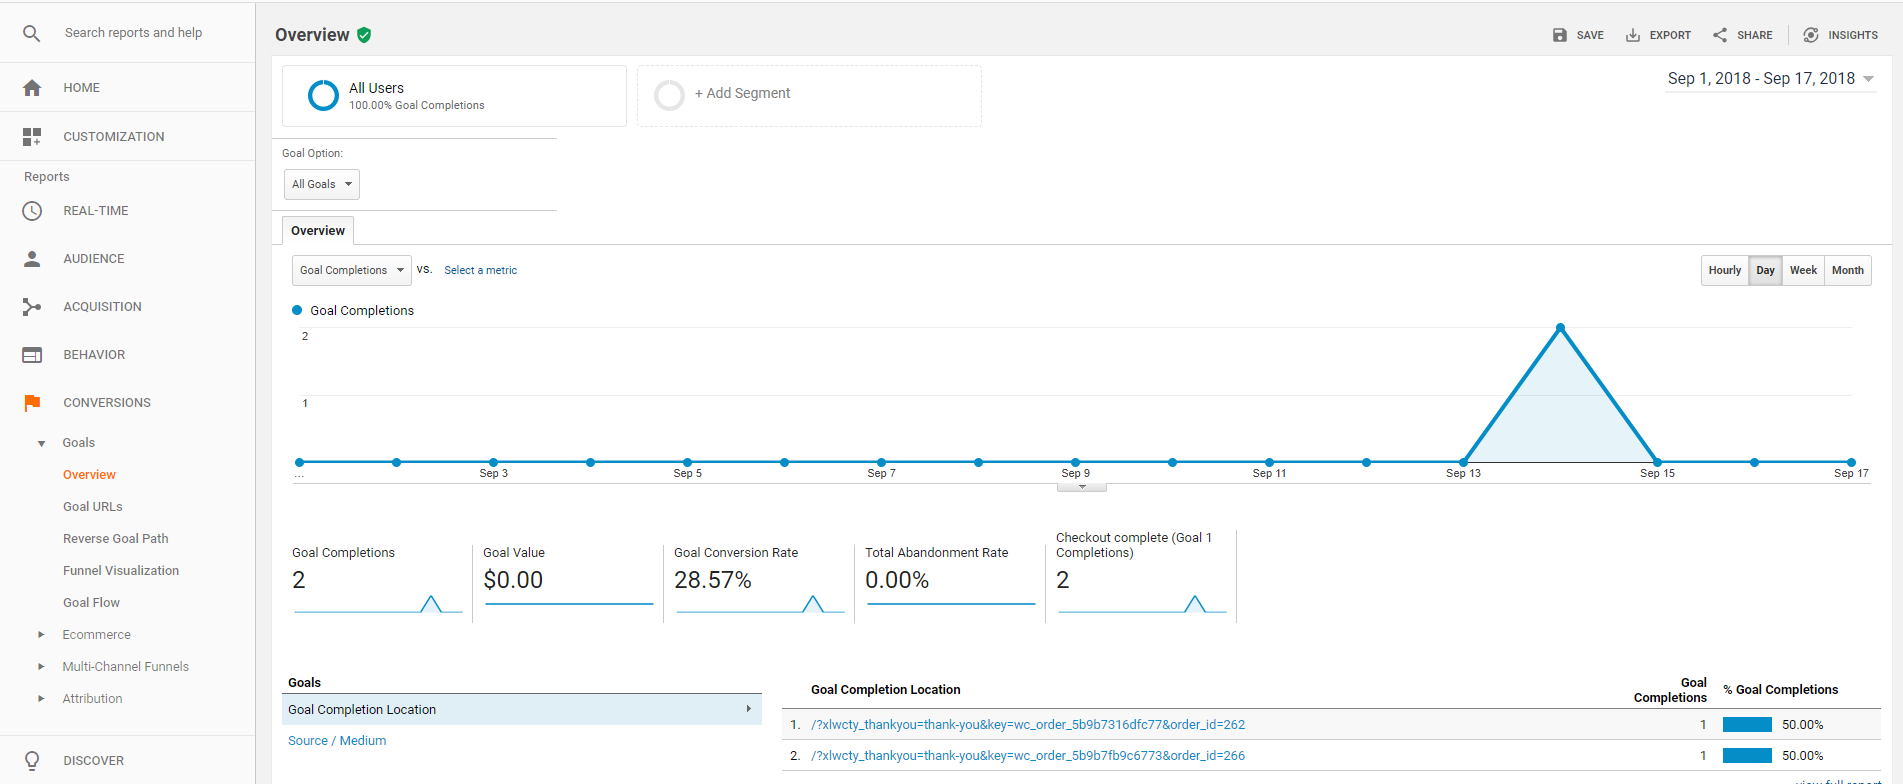
Goals
As defined by Google and its suggestive name Goals are being used to measure how frequently your visitors complete certain actions.
With Goals, you can monitor the performance of your eCommerce store as well as whether you are meeting the desired quotas.
Through the Google Analytics dashboard, some of the goals that you can create are when a user completes a purchase and/or a new user registration.
Therefore, It’s important to set up goals for your eCommerce store as it will allow you to evaluate your conversion rate.
This information will allow you to reevaluate certain business aspects of marketing strategies to ultimately increase your revenue!
Click here to learn more on Creating Goals
E-commerce
In this section of the Conversions tab, you’ll find yourself spending the most time. As it shows you all the relevant information regarding completed transactions.
I’ve added some test orders to check that all the tracking we set up earlier is working.
As a result, on the Overview tab of eCommerce you are able to see the overall Revenue for a specified time period, the Conversion Rate, Total Transactions, and Average Order Value.
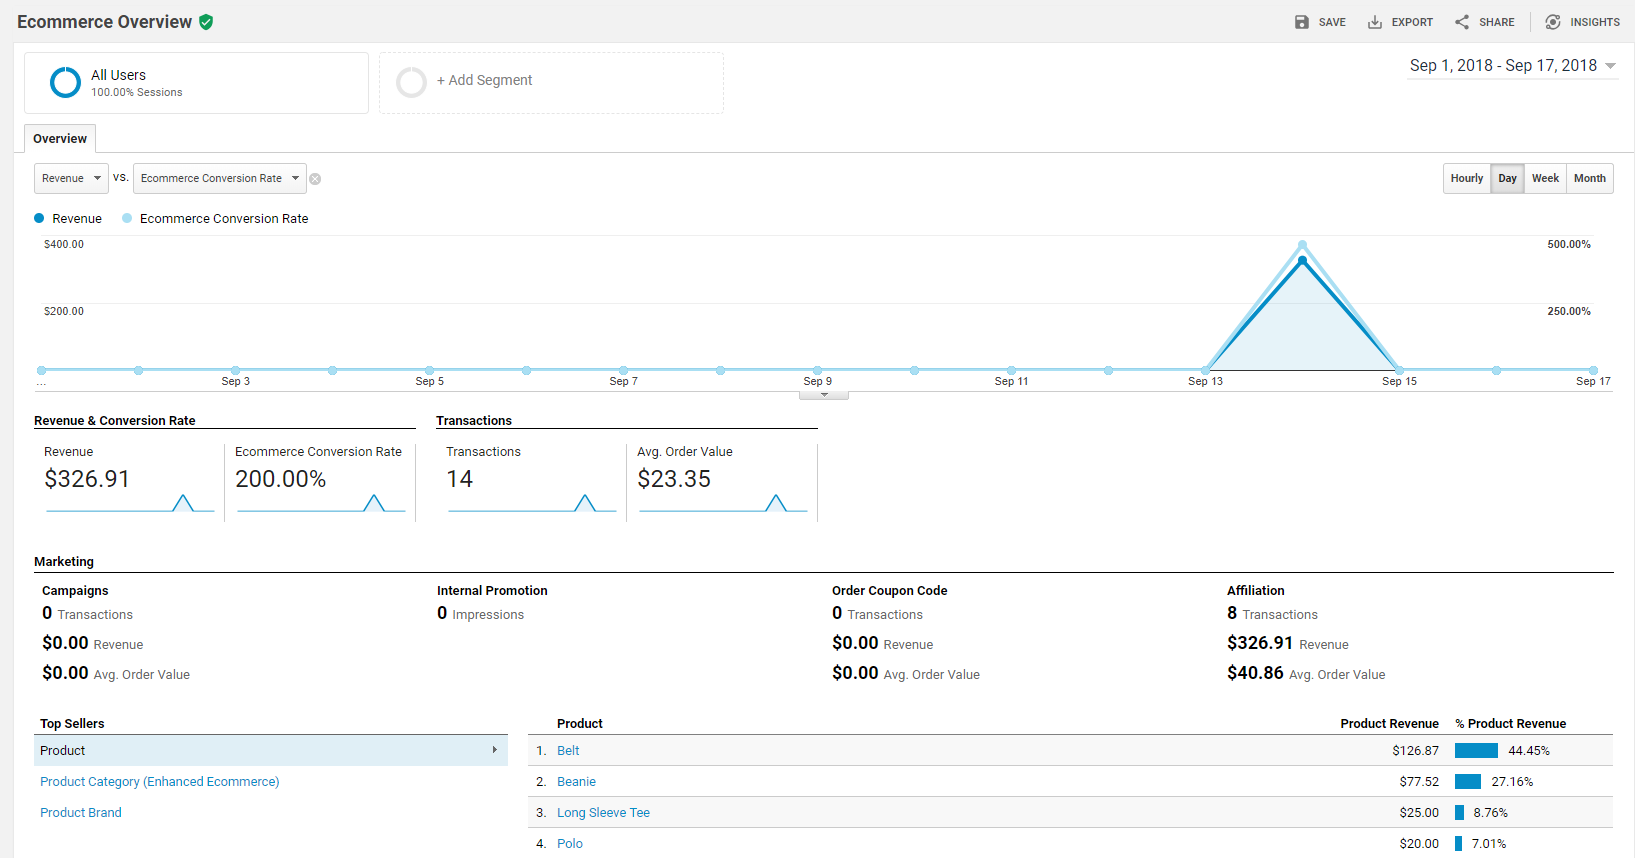
Additionally, in the E-commerce Reporting tab you will be able to retrieve the following reports:
- Shopping Behavior
- Checkout Behavior
- Product Performance
- Sales Performance
- Product List Performance
Let’s take a quick look at what you are expected to see on each report.
Shopping Behavior
This is one of the enhanced eCommerce reports provided by Google.
Essentially, it shows you graphically how many visitors entered your purchase funnel, as well as how many of them continued by clicking on the next step.

It also tracks at which point of the funnel your potential customer decided to abandon it, making it super easy to identify potential revenue leaks and patch them accordingly.
Checkout Behavior
Checkout behavior report is similar to the shopping behavior report, although with this report you’re able to see how your users navigate through each step of your checkout process.
As well as how many of them abandoned it and in which step.
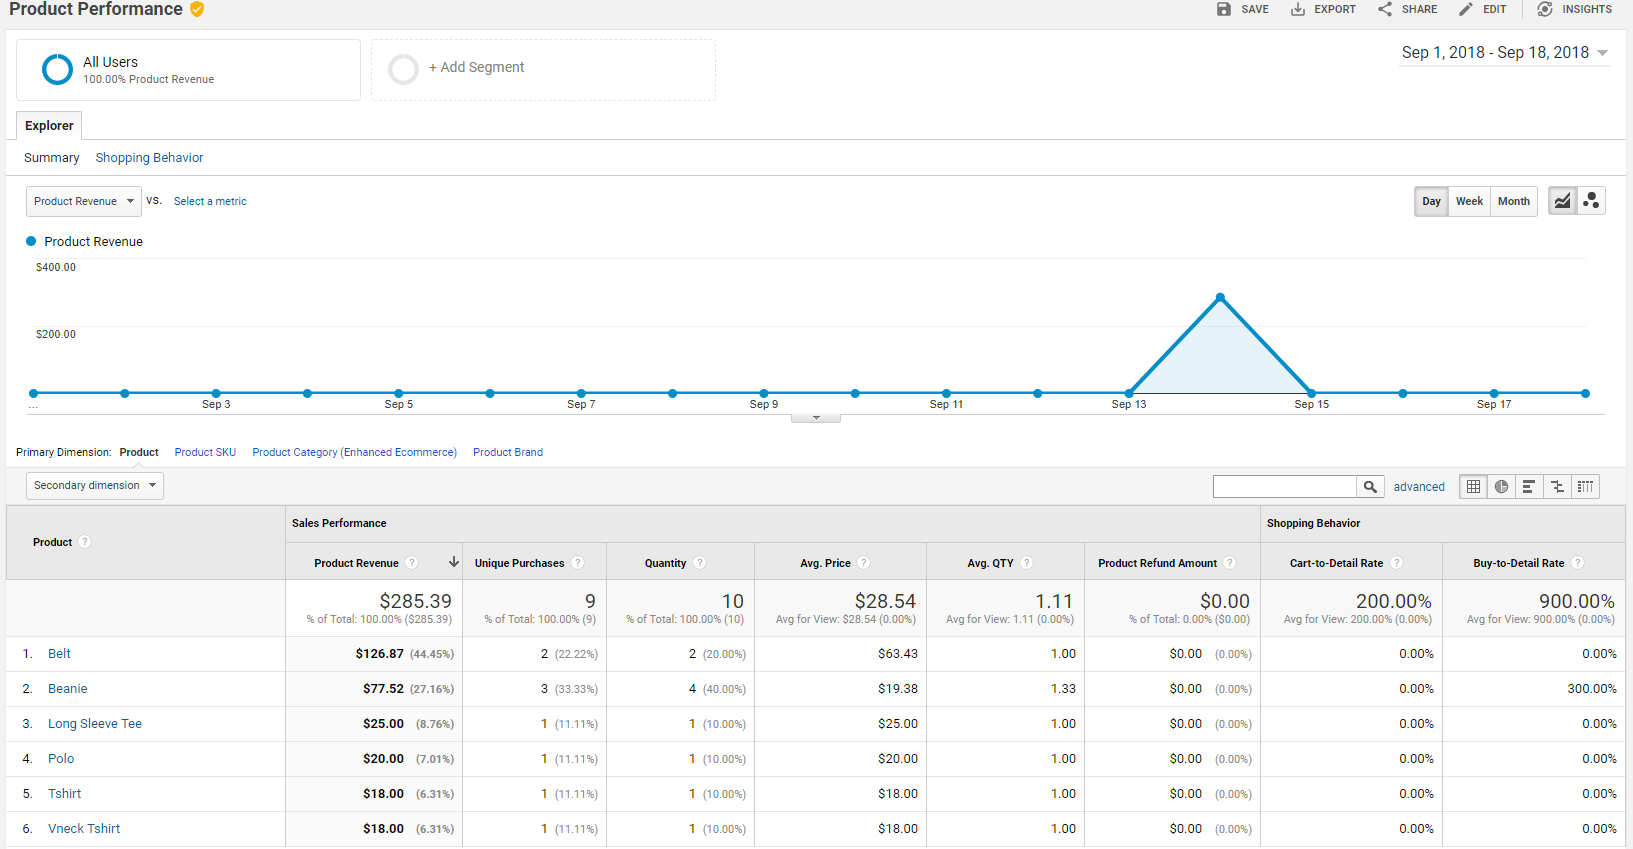
Product Performance
As the name suggests in this report you are able to how individual products are performing based on different metrics.
The metrics that Google Analytics eCommerce reports for product performance are:
- Product Revenue
- Unique Purchases
- Quantity
- Average Price
- Average Quantity
- Product Refund Amount
- Cart-To-Detail Rate
- Buy-To-Detail Rate
This particular report is really helpful if you run a specific product promotion and you want to monitor how well it is performing.
Sales Performance
Within the sales performance, you are able to take a look at various statistics based on each transaction that took place.
Those statistics include:
- Revenue
- Tax
- Shipping Cost
- Refund Amount
- Quantity
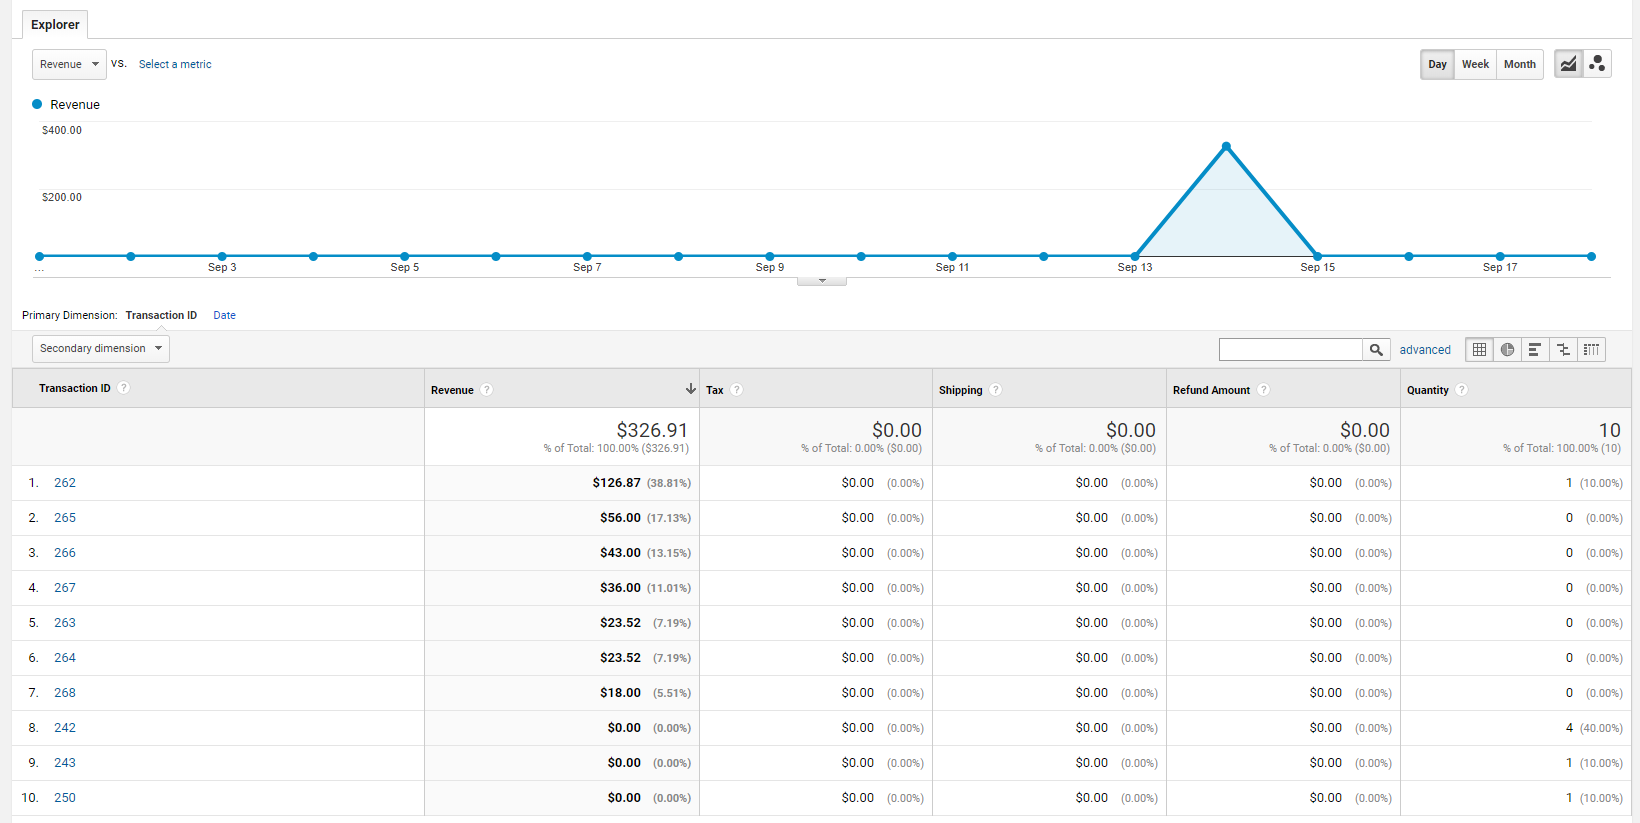
In addition to that, you can also select Date from the Primary Dimension section to showcase metrics based on specific days.

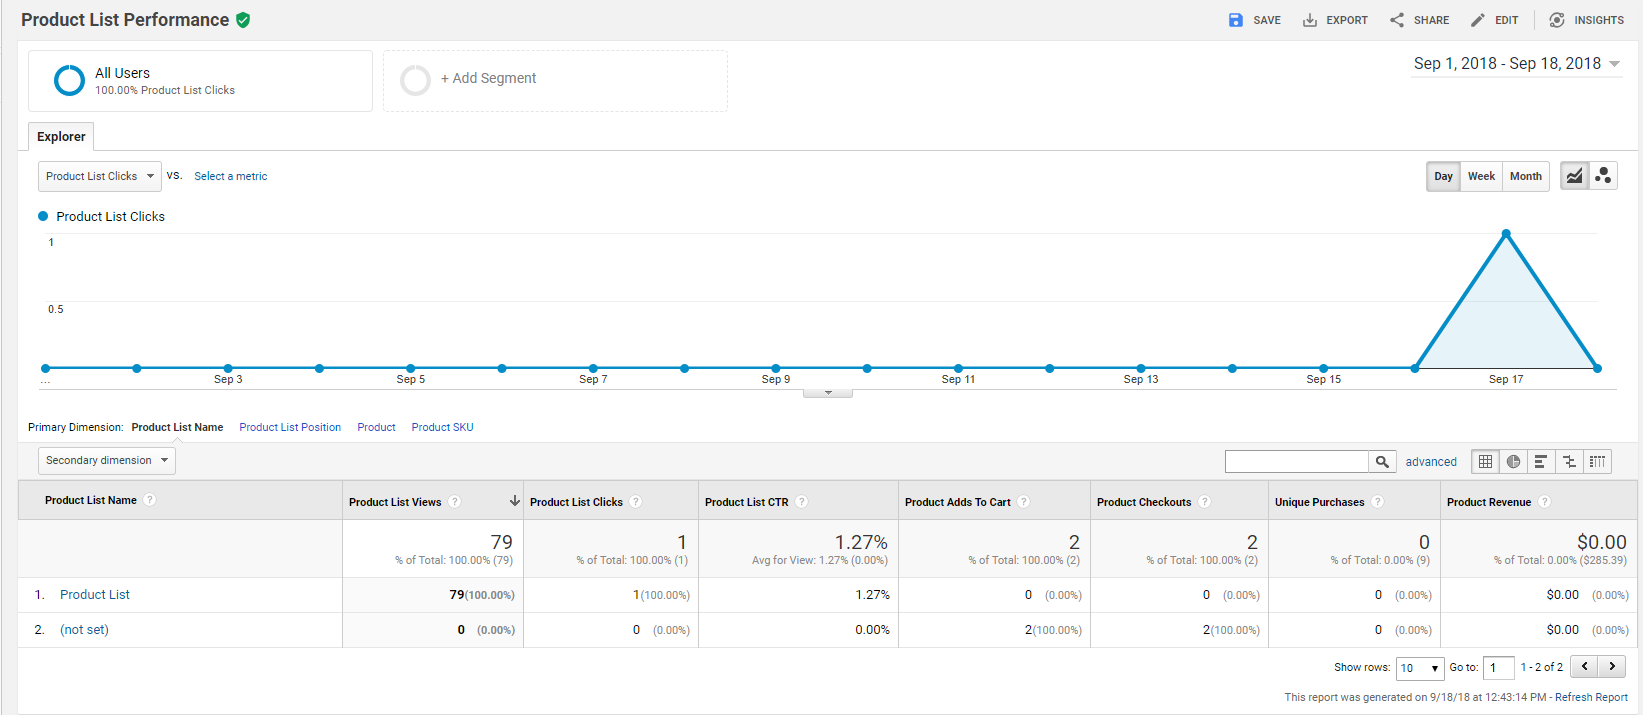
Product List Performance
The product list performance provides you with insights on your product lists, a product list is a set of products from your eCommerce store.
Using Google’s Analytics eCommerce Plugin(ec.js) you can create various product lists that can be used to monitor product performance.
Some examples of product lists are cross-sell and up-sell sections, related product lists and search result pages.
Through the report, you are able to see performance metrics for your product lists the available metrics are how many views a specific list has, how many people have clicked on that particular list as well as the CTR.
Marketing
The last section of the eCommerce reporting section is Marketing.
Which covers a range of Marketing statistics and it’s available only if you’ve enabled Enhanced eCommerce.
The available reports through the Marketing tab allow you to monitor Internal Promotions, Order/Product Coupons, and Affiliate Codes.
Final Thoughts
If you are reading this section congrats, you now know all the basics and even some advanced tips to set up your eCommerce Google Analytics reports. Hurray!
Throughout the article, we covered the main setup process of how to enable eCommerce Tracking for your e-shop, as well as how to interpret some if not all of the Google Analytics eCommerce reports available.
Google Analytics might seem complex and intimidating but by setting the right foundation you’ll be on your way to becoming a stats ninja!
Similar Posts

 Published by


Create, send and optimize your email marketing campaigns