


60+ Email Marketing Statistics & Trends To Know In 2026
Published By Alexandra Marinaki
July 20, 2021

20/07/21
We know email marketing is a powerful and effective tool for all business types and needs. But what’s also true is that sometimes numbers paint a clearer picture than words.
Therefore, in this article, we’ll let the numbers do the talking. Our list of the most impressive email marketing statistics will tell you everything you need to know about how to turn business emails into a real asset for your goals.
How we selected the data:
Our objective is to present you with the most reliable and up-to-date email marketing statistics. We researched and pulled data from authoritative websites and benchmark reports: Statista, ZeroBounce, Ascend2, Moosend, Constant Contact, and Litmus.
So, every statistic in this list comes from a trustworthy site. Also, the surveys and reports we used as reference were conducted between 2023 and 2025. This makes the insights relevant to current marketing needs.
But market research is a never-ending process. This is why we plan on updating the data regularly to keep the content fresh and value-packed, so you can stay ahead of the curve.
Turn numbers into success
Get real-time reports and optimize your campaigns from $9/month
Get startedGeneral Email Marketing Statistics
Let’s kick off with some generic stats around email marketing. How many emails are delivered per day, and how do shoppers interact with them? Why do business owners and marketers invest in email? Read on to find out more:
- In 2023, there were 4.37 billion global email users, and by 2027, this number is expected to grow to 4.89 billion. – Statista
- 361.6 billion is the approximate number of emails that were sent and delivered in 2024. This figure could reach 408.2 by 2027. – Statista
- 42% of respondents stated that they check their emails three to five times a day. – ZeroBounce
- The two most popular attributes of email marketing that make marketers trust it are its easy implementation (36%) and its cost-effectiveness (30%). – Constant Contact
- 63% of marketers reported that they are likely to boost their email activity. – Validity
- 37% of small businesses rely on email marketing software to market their products or services. – Localiq
- The main reason why brands procrastinate on email campaign management is lack of time. – Constant Contact
- 39% of small business owners use email to connect with their audience and increase conversions:

Email Subject Line & Content Stats
How do you craft an email marketing campaign that people open, read, and ultimately act on? Everything starts with the subject line.
Here, we’ll present you with some stats related to compelling subject lines and spot-on email content to keep drawing your customers’ attention once they’ve opened your emails.
- 47% of users mention that they decide whether they’ll open an email based on the subject line – AWeber
- Personalization in subject lines contributes to a better email performance for 77% of marketers, followed by the addition of emojis (73%) – Litmus
- A compelling subject line is the second reason why people open emails from brands, the first one being the relevancy of the message. – ZeroBounce
- Subject line optimization is among the most common use cases of AI for marketers:

Moving to other essential components of your email campaigns, below you’ll find some insightful stats:
- 43% of respondents say they use only one CTA in their email campaigns, whereas 30% add two. – Databox
- 67% of users prefer to receive shorter emails from their favorite brands. – ZeroBounce
- For 75.9% of professionals, adding an email signature to their emails played some part in moving towards or closing a sale. – Databox
- In small business email marketing, 50% people stated that promotional emails are the most important email campaign they deliver to their subscribers. – Databox
Email Click-Through & Open Rates Stats
When sending an email to your subscribers, you set a particular goal and want your readers to take a specific action. That’s why the vast majority of business emails contain the so-called call-to-action (CTA) buttons.
To determine the success of their campaigns, email marketers monitor email open and click-through rates (CTR).
Here’s some valuable information around these metrics:
- The average open and click rates for emails across all industries is 42.35% and 2%, respectively. – Mailerlite
- When monitoring opens and clicks, the top-performing campaigns are RSS emails (56.74 and 10.57) and autoresponders (51.05 and 5.59) – GetResponse
- When it comes to regions, marketers that sent emails in Australia saw the highest open and click-through rates (46.34% and 2.35%). – Mailerlite
- Welcome emails get high open rates (83.63%) with a CTR of 16.6%, outperforming most email marketing types. – GetResponse
- According to Moosend’s research, Thursday is the best day to send an email in terms of open rates; Saturday is the worst.

Email Deliverability Stats
Email deliverability is one of the most crucial parameters in email marketing. In short, it’s the metric that shows how many emails reached subscribers’ inboxes.
Getting your messages in front of your customers is significant for your success, so you can’t leave things to chance.
Here are some useful stats to grasp:
- 83.1% is the average email deliverability rate across email service providers. – EmailToolTester
- Spam emails took over 46.8 percent of the total email traffic share in December 2023. – Statista
- 16.9% of all emails never reach the mailbox because of deliverability issues. – EmailToolTester
- In 2024, 44% of marketers stated that the average spam complaint rate of their emails was less than or equal to 0.1%. – Validity
- The average unsubscribe rate across industries is 0.15%. – GetResponse
- Authors and photo and video businesses were the industries with the highest unsubscribe rates, whereas nonprofits and travel monitor 0.00% unsubscribe rates. – Mailerlite
- The most common emails that land in the spam folder have topics related to prizes and giveaways (36.7 %). – EmailToolTester
- 80% of participants mentioned they make a spam complaint because the message looks spammy. – ZeroBounce
Email Marketing ROI Statistics
Email marketing helps you increase your return on investment and maximize your sales and business growth. The following numbers justify this statement:
- We expect email marketing global revenue to increase to 17.9 billion by 2027. – Statista
- For every $1 you spend on email marketing campaigns, you can get a $36 return on investment. – Litmus
- 50% of consumers completed a purchase through an email campaign (50%). – Marigold
- For 38% of marketers, email ROI is the most crucial KPI to measure the channel’s performance. – Ascend2
- The industry with the highest ROI at 45:1 is retail. – Litmus
- 47% of marketers reported measuring their campaign ROI as one of their top email marketing challenges. – Ascend2
- Brands that incorporate A/B testing in their email marketing strategy monitor a 42:1 return on investment compared to 23.1% for those who don’t. – Litmus
Email Automation Statistics
Email automation software has proven to be game-changing for B2C and B2B business owners and marketers. Learn these helpful automation stats and find the best marketing tool to meet your business goals:
- 84% of marketing campaigns are automated to some level. – Ascend2
- In 2024, automated emails outperformed scheduled ones by 52% (opens), 332% (clicks), and 2361% (conversions). – Omnisend
- For eCommerce businesses, automated workflows are among the top criteria for evaluating an email marketing tool. – Databox
- Welcome emails, abandoned cart, and browse abandonment campaigns accounted for 87% of automated orders. – Omnisend
- 47% of marketing professionals said they were planning to add email automation to their marketing mix in the next year. – Ascend2
- One out of three people made a purchase after clicking on an automated message. – Omnisend
- 40% of small businesses are leaning on AI and automation to manage their marketing workload. Constant Contact
Email Segmentation & Personalization Stats
Personalized marketing works miracles for your business. With this term, we refer to a data-driven strategy that aims to deliver highly personalized experiences to customers and prospects that serve their individual needs.
Need more evidence to apply it? Have a look:
- 53% of marketing professionals reported they want to use email personalization in the next year. (besides the recipient’s name) – Ascend2
- 78% of respondents said they are likely to engage with personalized emails with offers tailored to their needs. – Marigold
- A staggering 90% of marketers focus on segmentation for targeted campaigns and better email performance. – Litmus
- 90% of respondents send personalized content and product/service recommendations in their email campaigns. – Databox
- Receiving irrelevant email content ranks among the top reasons for unsubscribes. – Constant Contact
- Personalized emails show higher open rates (44.3%) and lower bounce rates (2.26%) compared to non-personalized campaigns (39.13% and 2.50%). – GetResponse
- 80% of consumers find it cool when brands use their purchase history for personalized product recommendations. – Marigold
Email Frequency Statistics
Timing matters when sending email campaigns. You may send the right messages. But send too many of them and you’ll annoy subscribers. Send emails once in a while and they could forget all about you.
So, here’s what to keep in mind when in search of the optimal email frequency:

- 69% of users said that getting too many emails from a brand makes them opt out. – Constant Contact
- 72% of marketers choose to adjust their email sending frequency based on how each recipient interacts with their emails. – Databox
- Email newsletters get a better 48.31% open rate when sent once a week compared to 43.2% when sent twice. – GetResponse
- Surprisingly, brands monitor the lowest unsubscribe rates (0.07%) when sending 14 newsletters (to highly engaged recipients). – GetResponse
B2B Email Marketing Statistics
Let’s assume that you own a B2B organization. What kind of stats should you consider when building or optimizing your B2B email marketing strategy?
Here are a few trends to start with:
- 71% of B2B marketing professionals stated they used email newsletters during the last 12 months. – Content Marketing Institute
- 31% of B2B marketers rely on email marketing to achieve business growth. – Ascend2
- 77% of consumers prefer brands to contact them via email during the buying process. – Sopro
- Email ranked among the top-performing channels for content distribution for 42% of B2B professionals. – Content Marketing Institute
- According to research, email is the second best channel for generating sales and marketing leads as a B2B brand (with a 32% share). – Sagefrog
- The average conversion rate for B2B businesses using email is 2,40%. – FirstPageSage
B2C Email Marketing Statistics
And what about B2C? In eCommerce, communications through email can nurture your relationship with customers and turn them into loyal fans of your brand.
Let’s explore more:
- eCommerce emails get an average open rate of 37.93%. – Klaviyo
- 68% of shoppers appreciate it when brands use an email campaign to remind them of abandoned items left in their cart. – Marigold
- 41% of consumers turn to their inboxes when they want to look for discounts from brands. – ZeroBounce
- B2C marketers monitor a 2.8% conversion rate when using email to communicate with their audience. – FirstPageSage
- B2C companies that set up automated cart abandonment emails watch their conversion rate increase by 50%. – Moosend
Mobile Email Marketing Stats
Finally, consumers spend lots of time on their mobile devices checking their inboxes for offers and updates. Inevitably, some of the purchase decisions they make will happen on the go.
Let’s dive more into that:

- Over than half of the global website traffic comes from mobile devices. – Statista
- 64% of users check their inboxes on mobile devices. – ZeroBounce
- In 2022, 53% of marketers said they would adopt mobile-friendly email design in the next year. – Ascend2
- According to findings, nearly one in five emails wasn’t optimized for mobile. – SuperOffice
How To Improve Your Email Marketing Performance
In this article, we shared general data around email marketing from multiple sources. But how will these insights help you optimize your email marketing strategy?
To take it one step further, we gathered a few tips on how to upgrade your game and let your top-notch emails bring you the desired revenue:
1. Write an Inviting Subject Line
According to the stats above, targeted subject lines can convince your email subscribers to open your emails and take the desired action. First off, personalizing the subject lines is undoubtedly a successful tactic.
Despite that, here’s what else to keep in mind:
- Craft a concise subject line that will draw the reader’s attention straight away.
- Create a consistent experience by aligning the subject line with your brand voice.
- Ensure that the goal of the email is reflected from the very beginning.
- Make it short (below 40 characters) to facilitate the mobile experience.
For example, let’s imagine you want to find the best subject line for a welcome email, since recent stats show it gets high open rates. Here are some suggestions:
“Welcome to Moosend! Here’s what’s next.”
“Get started with Moosend.”
“Thanks for joining Moosend.”
However, avoid using misleading or pushy words, such as “urgent” or “now,” because your emails may end up in the spam folder.
And if you want to find the best subject line for your email but you’re uncertain about it, you can try Moosend’s free subject line tester, Refine.
Or you can experiment with A/B testing. Which is?
2. Conduct A/B Testing
With A/B testing, you can send two different email versions varying in one element to diverse audience groups, and the most successful will prevail.
For instance, you can compare two different subject line variations, and the one that receives the most opens will be sent to the majority of your subscribers.
This method allows you to experiment with email aspects and see how your subscribers respond to each of them. Identifying recurring patterns will help you optimize these processes in the future and gradually move towards success.
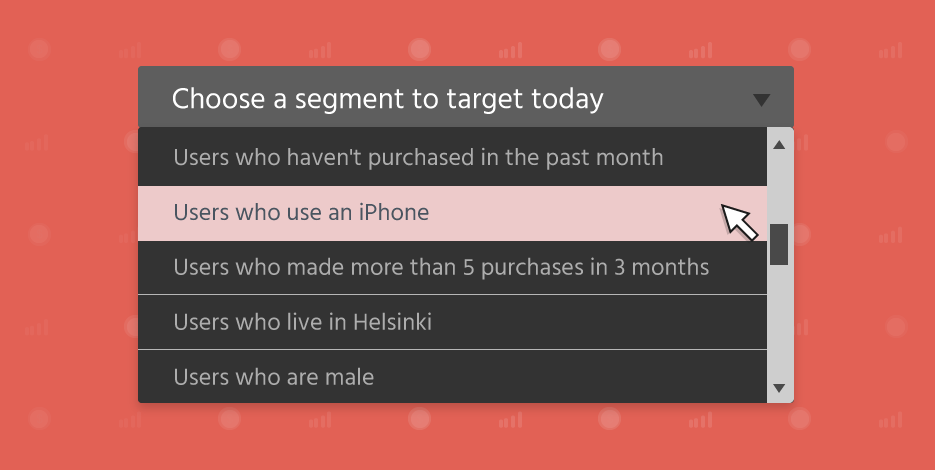
3. Try List Segmentation
On the way to delivering personalized experiences to subscribers, customer segmentation is a must.
By dividing your shoppers into segmented lists, you can target them based on their unique interests and needs. Therefore, you have higher chances of getting the open and click-through rates you desire.
For example, you can divide your customer base into different groups based on demographics, such as age or geographic location. You can also make a list of recurring customers, inactive subscribers, or loyalty program members, to name a few.
Whatever your criteria are, include the customer journey stage in the formula to craft convincing stories for your customers. Once you’re ready, write compelling email copy that matches your brand voice and create a call-to-action (CTA) that’s hard to miss.
4. Monitor Your Analytics
Determining how efficient your email marketing strategy is based on the data shared above isn’t enough. Instead, you should set your own KPIs based on your industry and goals and keep track of them regularly.
And remember, increasing your email ROI overnight is no easy feat. Allow yourselves to make mistakes in the process to improve in the future.
There’s no such thing as a magic recipe. So feel free to use the above email stats to set some primary goals and see what works for you in the long run.
5. Try an Email Spam Checker
But what happens when your emails end up in the spam/junk folder, even when you’ve got your subscribers’ opt in? This may damage your sender’s reputation in the future and affect your overall email marketing strategy.
If your lists are updated and you have your subscribers’ consent to contact them, you can use an email spam checker to avoid trouble.
In brief, it will test how your email will perform for certain ISPs and email clients and recommend ways to fix potential issues.
6. Get An All-In-One Marketing Solution
We saved the best for last! If you want to take control of your email marketing activities, it’s best to find a marketing platform that lets you perform most of these actions in one place.
An email automation solution like Moosend has all the features you need to set up promotional and transactional emails in simple steps and easily track their performance.
Plus, via API connectors, you can couple it with your existing tech stack, such as your CRM solution, and make the most of it.
Email Marketing Stats Show You The Way
In a nutshell, these key email marketing statistics shed light on how effective some tactics are. You can use that data to compare it with your own results and see if you’re heading the right way.
But keep in mind that email marketing is constantly evolving. Plus, every market has its own rules and trends. What matters the most is having a deep understanding of your buyer personas and how they usually behave.
Use the stats to get inspired, and then draw your own pathways to conversion.
Are you looking for an email automation platform with all the necessary features to streamline your email marketing processes? Sign up for a Moosend account and start your journey today!
Similar Posts

 Published by

 Published by

Create, send and optimize your email marketing campaigns