Essential Black Friday Statistics You Need To Know In 2025
Even if you’ve already planned your Black Friday marketing strategy, it’s never too late to review some essential Black Friday statistics. But why should you take the time to check these stats?
Data-driven insights allow you to fine-tune your marketing approach. Whether your strategy focuses on email, SMS, social media, or in-store marketing, leveraging statistics ensures you align with consumer trends and behaviors.
By understanding key data points, you can optimize campaigns for maximum conversions, adjust pricing strategies, and target the right audiences at the right time. As Jeff Weiner once said, “Data really powers everything that we do.”
So with this in mind, we collected some impressive Black Friday stats you need to know to revamp your strategy.
Holiday Trends for This Year
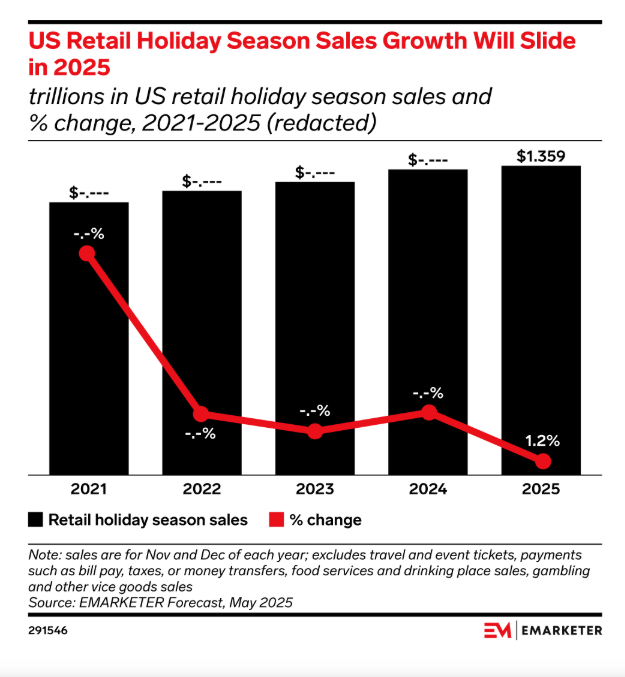
As we approach the holiday shopping season, forecasts show a drop in holiday sales growth. More specifically, they predict that in 2025 it will decrease by 1.2%.
However, considering that last year US eCommerce holiday sales grew by 8.7% and reached $241.4 billion, they’re still going strong.
Overall, Adobe prepares us for a good holiday season based on early data trends. This year, consumers are expected to start shopping earlier, making early-bird and exclusive discounts a smart idea for retailers.
Compared to previous years, omnichannel shopping and AI-powered personalization will gain more ground. Shoppers will look for flexibility in payment, such as Buy Now, Pay Later (BNPL) options.
Finally, fast checkout processes and optimal customer service will play a key role in shaping top-notch customer experiences.
Black Friday Online Sales Stats
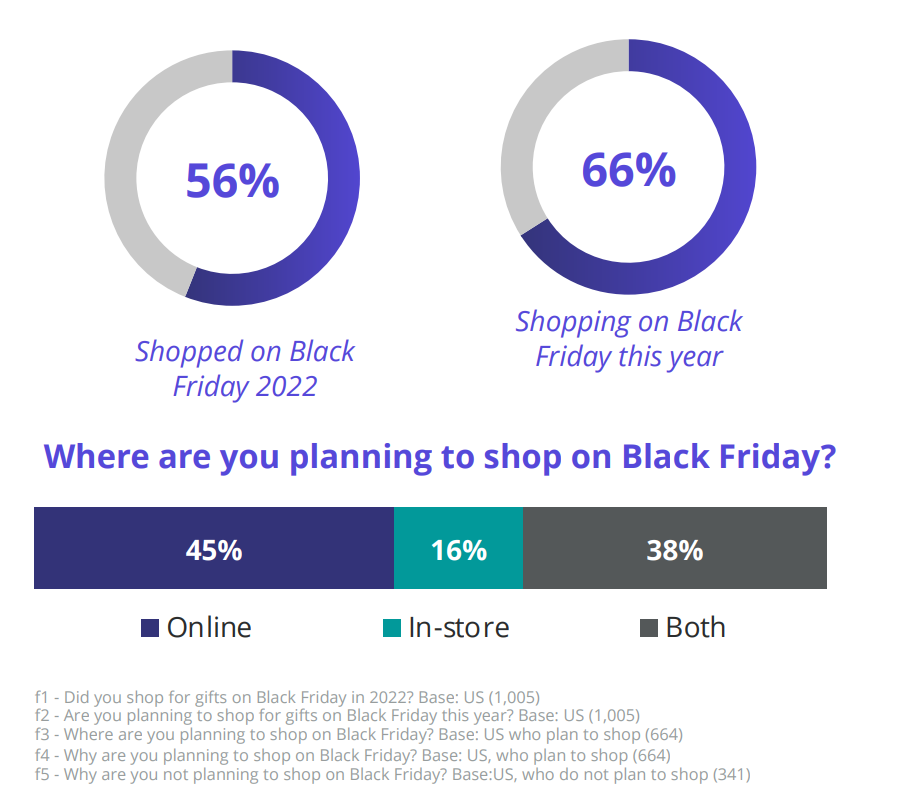
Online shopping is still king, with 45% of consumers choosing eCommerce stores to purchase during Black Friday.
Here are the most important online sales statistics to consider:
- In 2024, the total holiday spending (Nov 1st – Dec 31st) reached $241.4 billion – Adobe
- 58% of online shoppers indicated that they were more likely to make a purchase from Amazon vs. a brand’s site. – Sitecore
- In 2024, 34% of people stated they’d start Black Friday shopping on Thanksgiving. – DriveResearch
- Last year, 66% planned to shop on Black Friday, making online the dominant channel. – Sitecore
In a nutshell, as eCommerce is on the rise, businesses need to have a solid digital marketing strategy with tactics focusing on seasonal shoppers and their pain points.
Retail Store Sales Statistics
Walmart, Target, and Kohl’s were the most popular for 2023 as post-pandemic consumers started visiting more and more in-person shopping destinations:
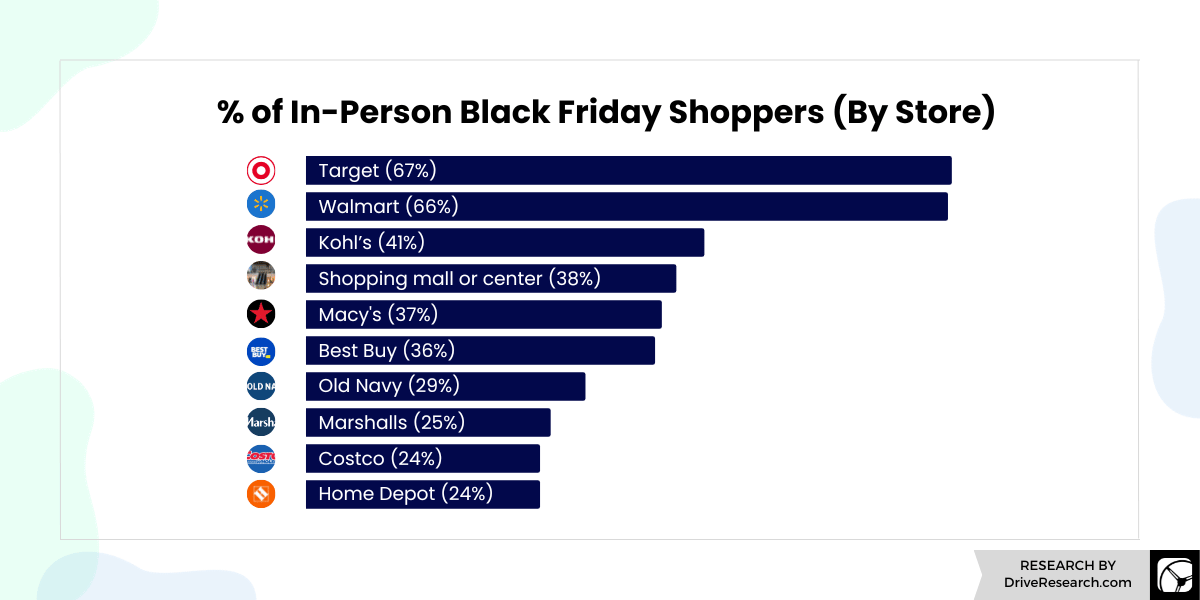
Here are the most prominent Black Friday statistics from the retail sphere:
- Retail grew only 2% from last year, while eCommerce grew 7.75% in the third quarter of 2023. – Forbes
- 63% of consumers go to physical stores to ensure product quality. – Deloitte
- 20% of shoppers planned to spend $1,000 or more during the holiday season. – DriveResearch
- The average online discount offered by retailers decreased from 42% in 2019 to 36% in 2024. – Sherwood
Hence, consumers will opt for an eCommerce and in-person combo. So embrace digital retail marketing strategies like creating emails, posting on social media, and working with influencers, especially during holidays like Black Friday.
Black Friday Email Marketing Stats
The majority, if not all, of online stores, will promote their special deals through various means. The most popular is email marketing. Ecommerce businesses and online retailers send converting email campaigns to target their shoppers, giving them irresistible offers, discounts, and coupons.
Below, we’ll see some Black Friday statistics to help you out with your Black Friday email marketing strategy:
- Referral and loyalty workflows increased by 82% in year-over-year revenue. – Drip
- 61.3% of consumers prefer to hear from brands via email, followed by websites and social media.– Sinch
- Personalized Black Friday emails receive a 15% higher open rate compared to non-personalized emails. – NotifyVisitor
- 75.1% costumers prefer receiving transactional emails compared to 43.4% who choose to get informed via SMS transactional updates. – Sinch
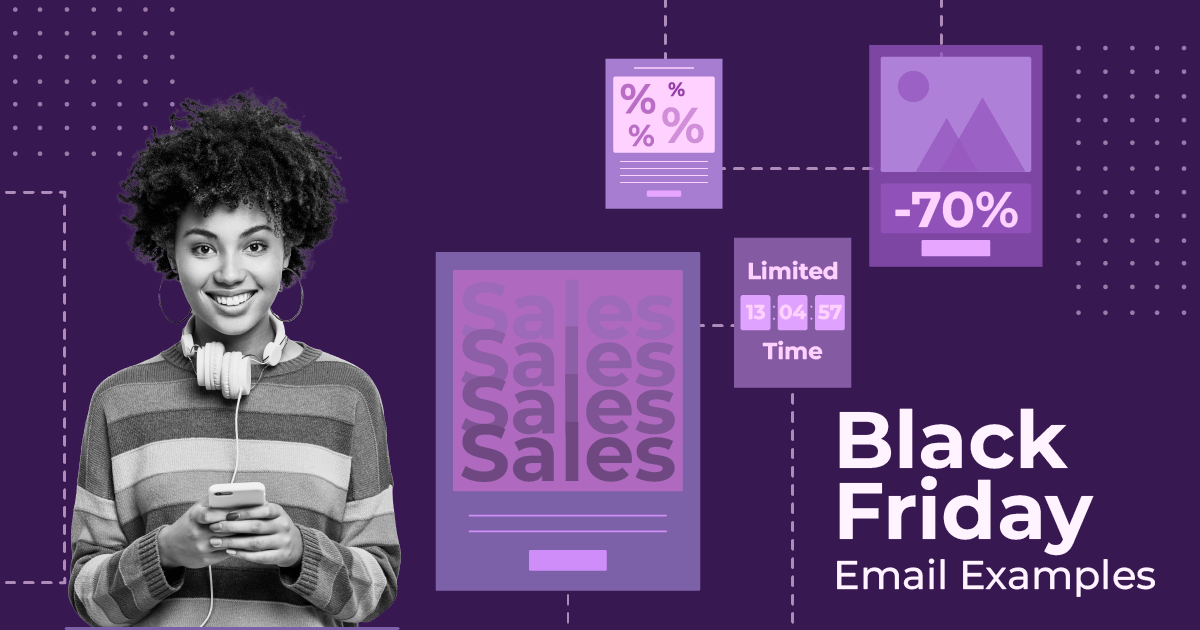
Black Friday and email marketing are a combo you should leverage to boost your seasonal sales. Here are some great Black Friday email examples from popular online stores and some tips to inspire you for this Black Friday.
Also, if you need help creating your seasonal email campaigns, you can use an email tool like Moosend to craft the perfect sales messages. All you need is to sign up for an account and hop into the email editor.
Mobile Vs. Desktop Black Friday Statistics
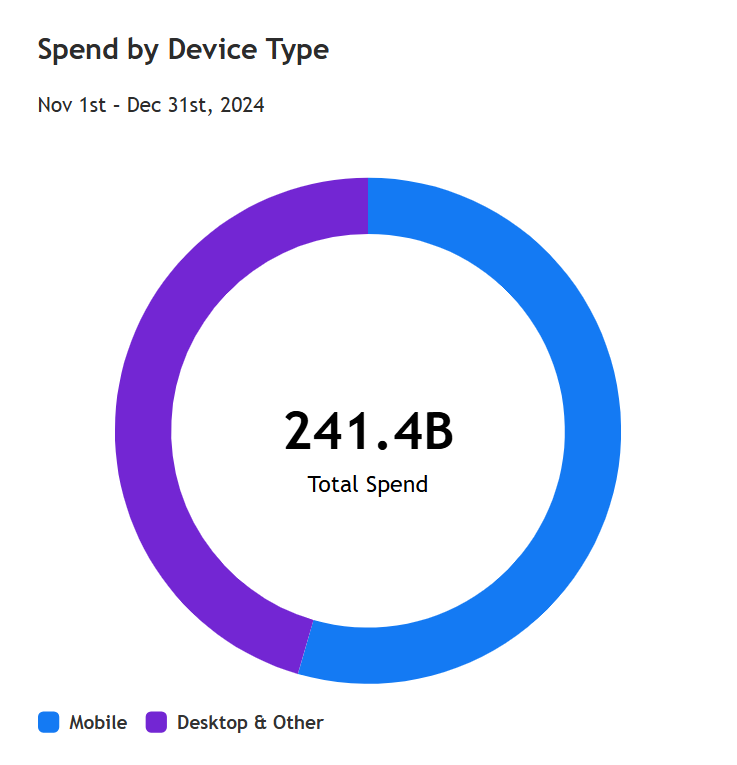
Mobile shopping has become more and more popular as customers are slowly turning into mobile-first users. More specifically, Adobe’s Analytics data shows that mobile revenue share will reach a record 54.5% of online purchases this year:
Here are a few Mobile vs. Desktop Black Friday statistics you need to keep in mind:
- Last year, total mobile spending was estimated to reach $131.5 billion, while desktop was at $109.9 billion. – Adobe
- Desktop has a 6.5 % conversion rate compared to mobile devices, with a 3.3% conversion rate. – Statista
- In 2024, mobile BNPL revenue share was estimated to be around 79%, while the forecasted spend was likely to reach $14.4 billion. – Adobe
As you can see, mobile devices are a big player for holiday shoppers. Online stores and retailers can benefit from SMS and email marketing more than ever to increase their revenue and incentivize shoppers to purchase.
Top Black Friday Product Categories
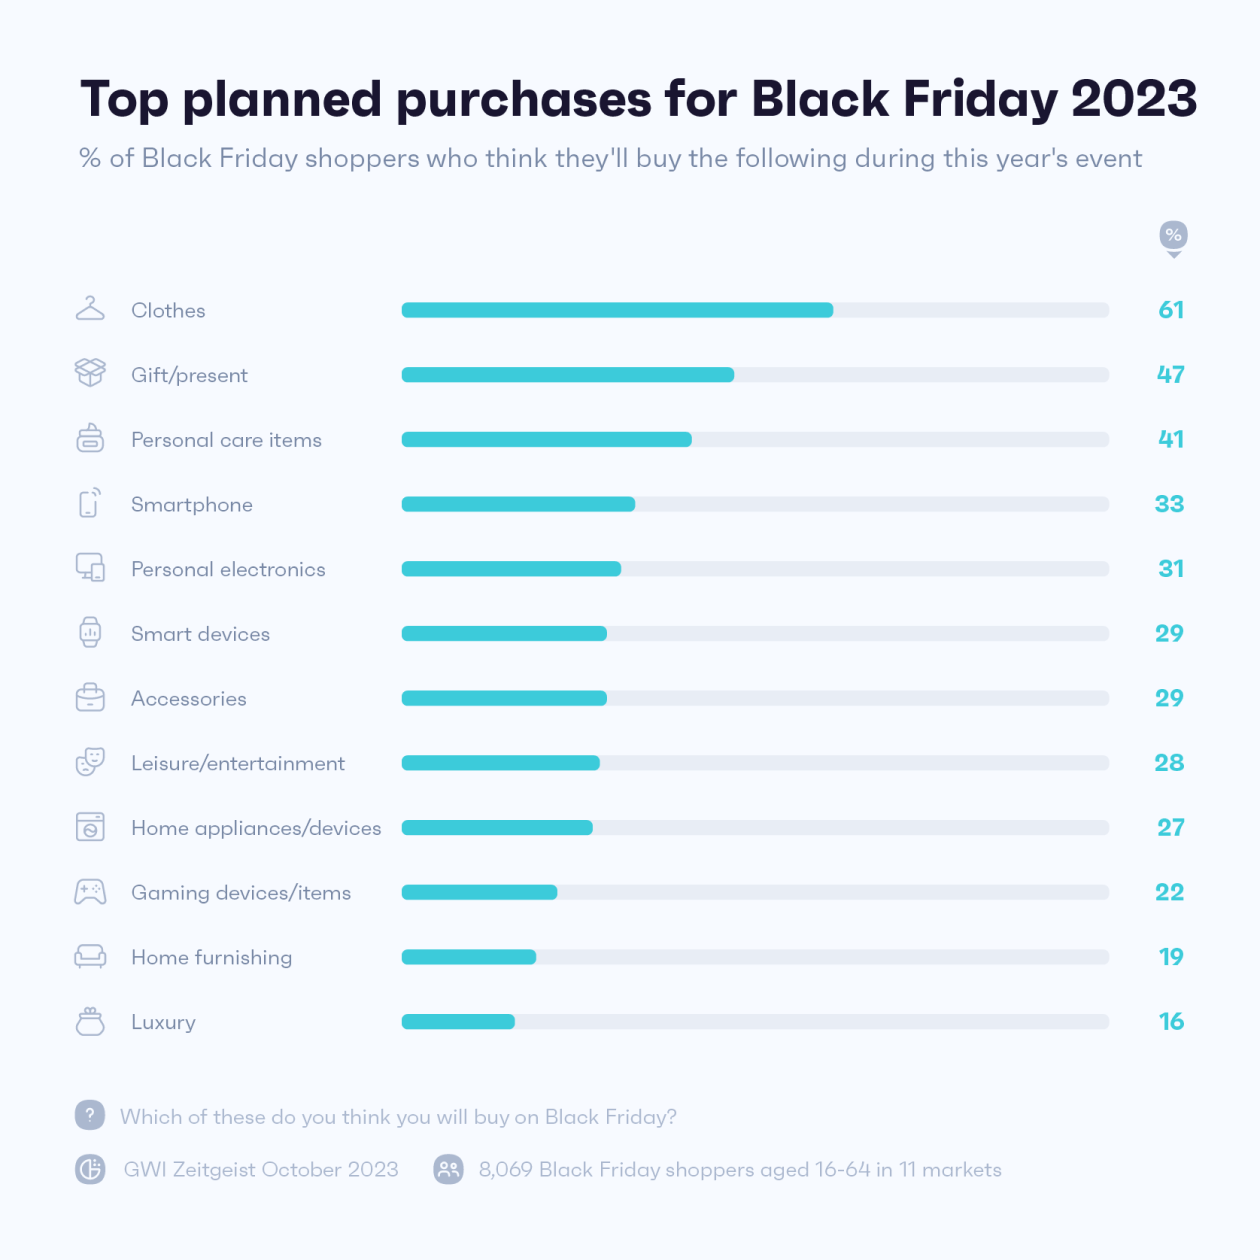
When it comes to Black Friday shopping, each year has its top product categories. Consumers seem to favor premium items at better prices, from consoles and jewelry to Apple’s new iPhone. Below, you can see the top holiday gift picks:
Here are a few things to consider:
- In 2024, makeup/skincare, smart watches, Harry Potter, and bedding and linens were among the hottest product picks. – Adobe
- Toys and games, apparel and accessories, luggage and bags, sporting goods, and electronics were the most popular product categories in the US. – Criteo
- In 2022, consumers spent more on Clothes/Accessories/Shoes, Electronics, and Toys. – NielsenIQ
Black Friday Shopper Insights
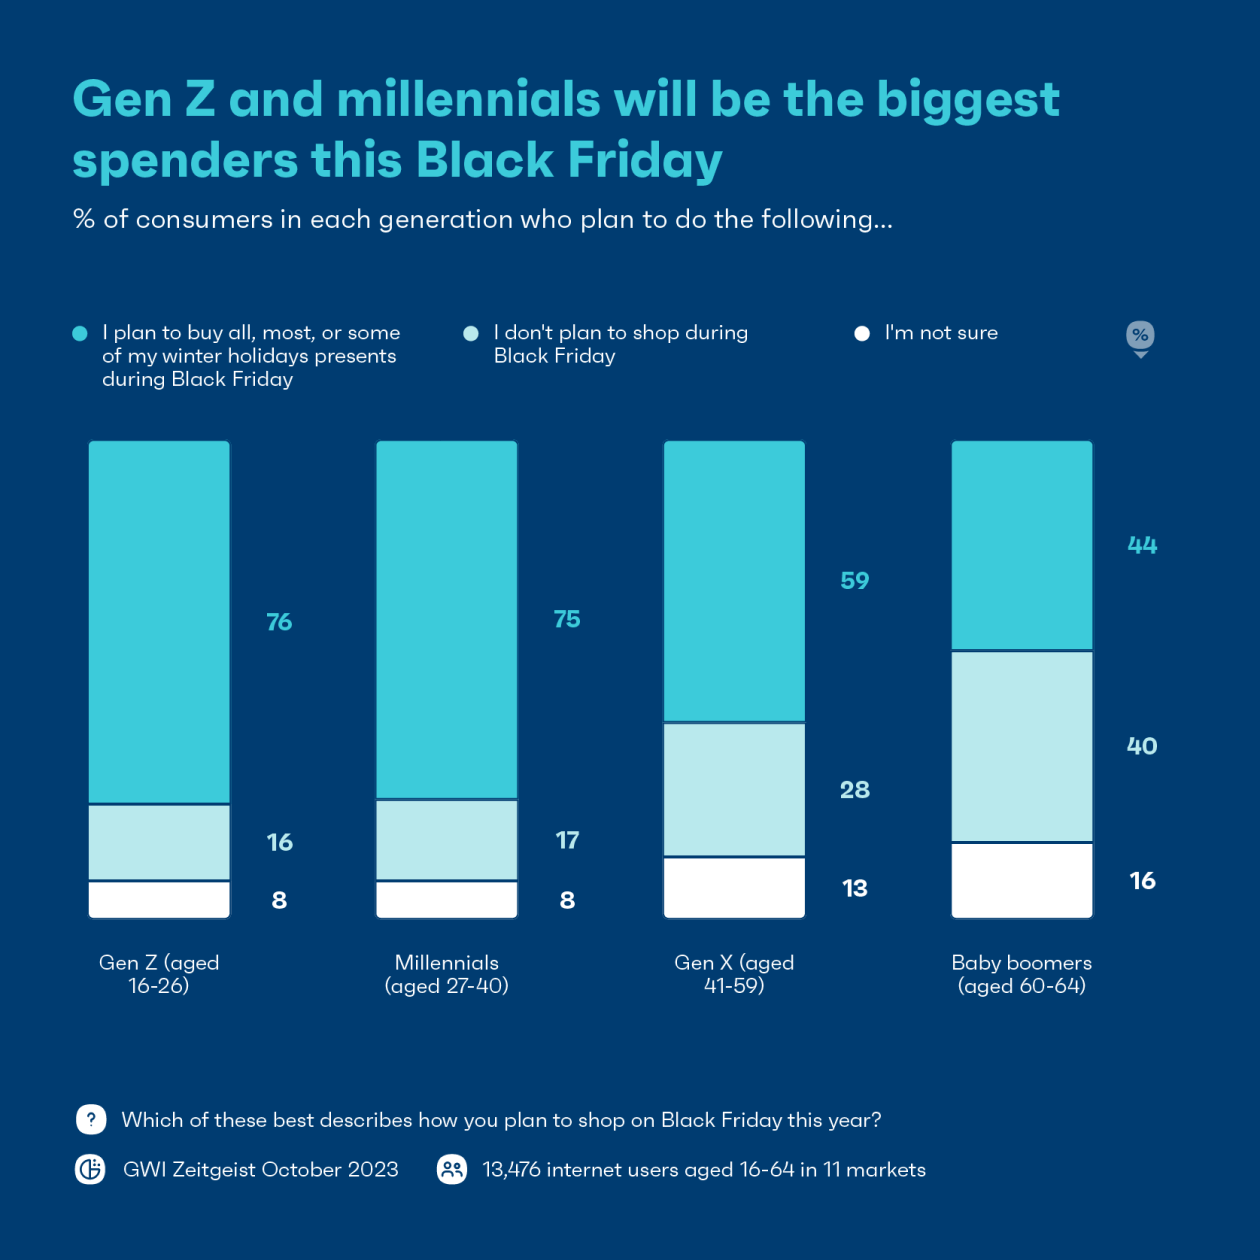
Holiday spending presents very different patterns based on the age group shoppers belong to. Apart from age, other demographic criteria that can influence a purchase include your shoppers’ gender, profession, interests, and even location.
The difference between Gen Z shoppers, Gen X, Baby Boomers, and Millennials is quite evident in the following graph:
Let’s see some Black Friday statistics about consumer spending:
- 22% said they’d use GenAI tools like ChatGPT or Bard to pick gifts. – Sitecore
- Millennials and Gen Z are among the biggest percentage of buyers who plan to shop on Black Friday. – Gwi
- The highest shopping activity is observed at midnight and 12 pm. – Black Friday Global
- 67% of shoppers won’t purchase without free shipping, and 84% will add more items to their cart to qualify for it. – Sitecore
- 78% want to see inventory levels, with 43% making an immediate purchase if stock is low and 26% adding it to their cart. – Sitecore
- BNPL spending was estimated to reach about $18.2 billion last season. – Adobe
- 23% of shoppers indicated that they make more impulse purchases during the holidays. – Sitecore
- 60% of Gen Z consumers stated that they regretted buying certain items on Black Friday. – Finder
- In 2024, the average spend per person on Black Friday reached $674 in the US. – Finder
- 55% of respondents indicated they would shop while at work on Black Friday. – Sitecore
Of course, some respondents claimed they would spend less on Black Friday. Here are some of the main reasons for that according to Drive Search:
- Rising living costs
- High inflation
- Rising costs of groceries
- Fluctuating interest rates
Black Friday Global Statistics
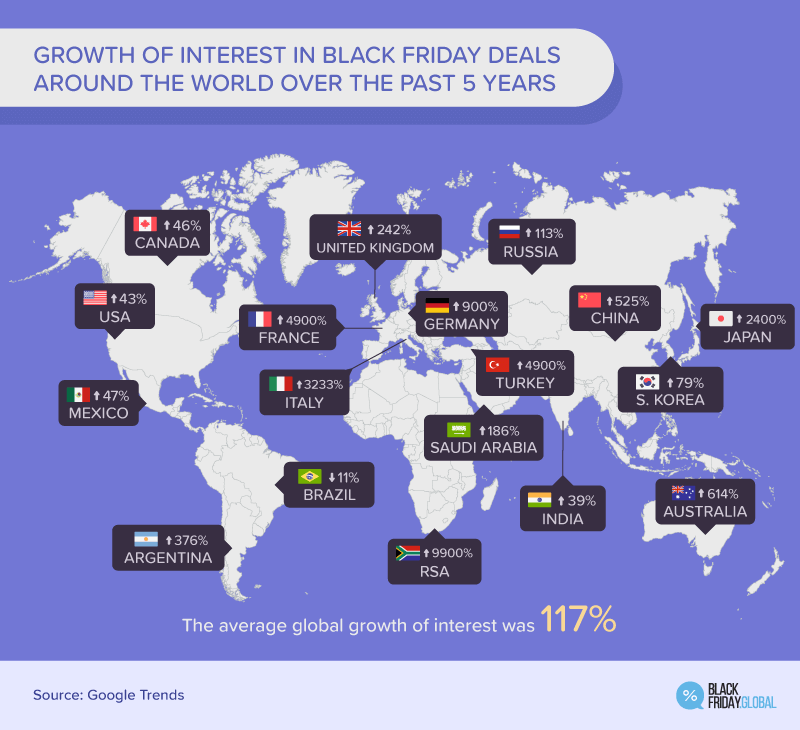
Despite being an American holiday, other countries presented an increase in Black Friday interest.
Sales also spike during the holiday. Compared to a regular Friday, here’s how sales grow in selected countries:
- Pakistan: 11,525%
- Hungary: 9,750%
- Italy: 4,516%
- Greece: 2,600%
- Germany: 2,106%
- USA: 2,103%
- Canada: 1,732%
- United Kingdom: 1,500%
On the other hand, Thailand, Peru, and Venezuela only have a small increase with 46%, 107% and 119% respectively.
Discount markdowns by country
Discount markdowns have a global average of 55%, with the average USA discount reaching 68% and the saving per American customer $1,094. Here are some average markdowns in selected countries:
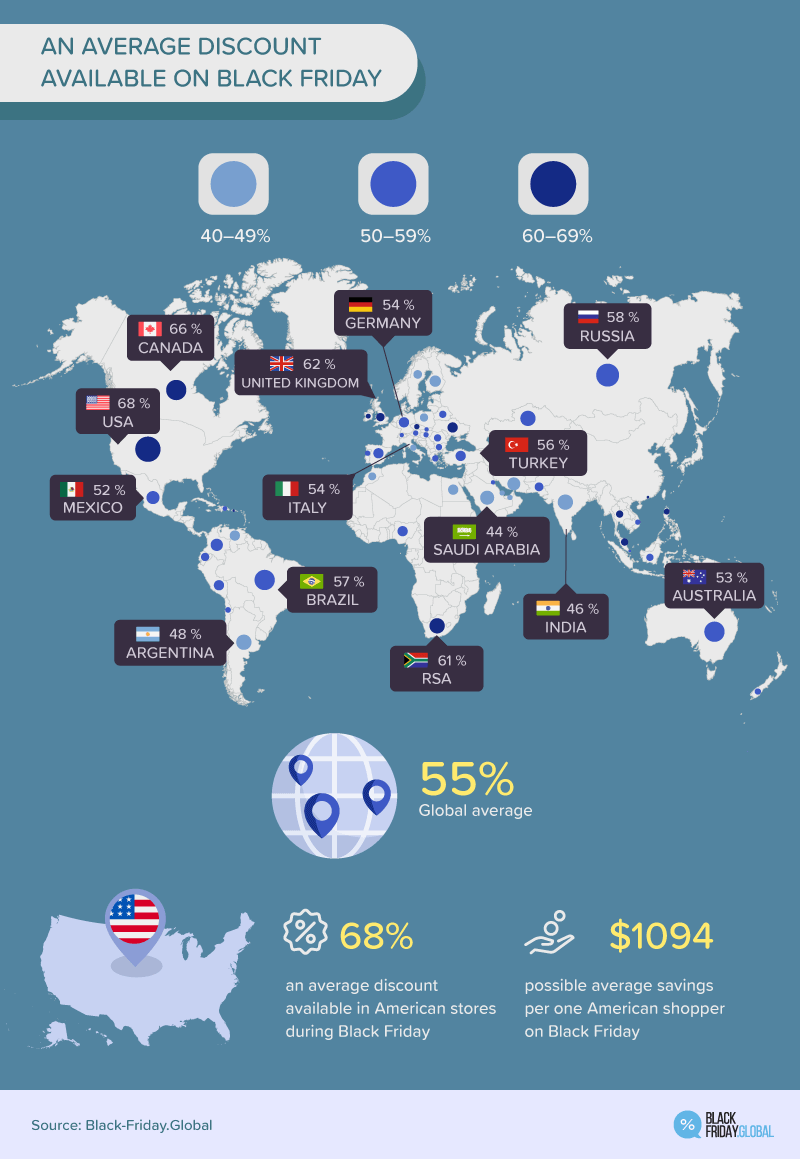
The highest (after the USA):
- Canada: 66%
- United Kingdom: 62%
- RSA: 61%
The lowest:
- India: 46%
- Argentina: 48%
- Mexico: 52%
Money spent by country
The following infographic shows different consumer spending habits across different regions, with North America showing higher spending tendencies compared to other parts of the world.
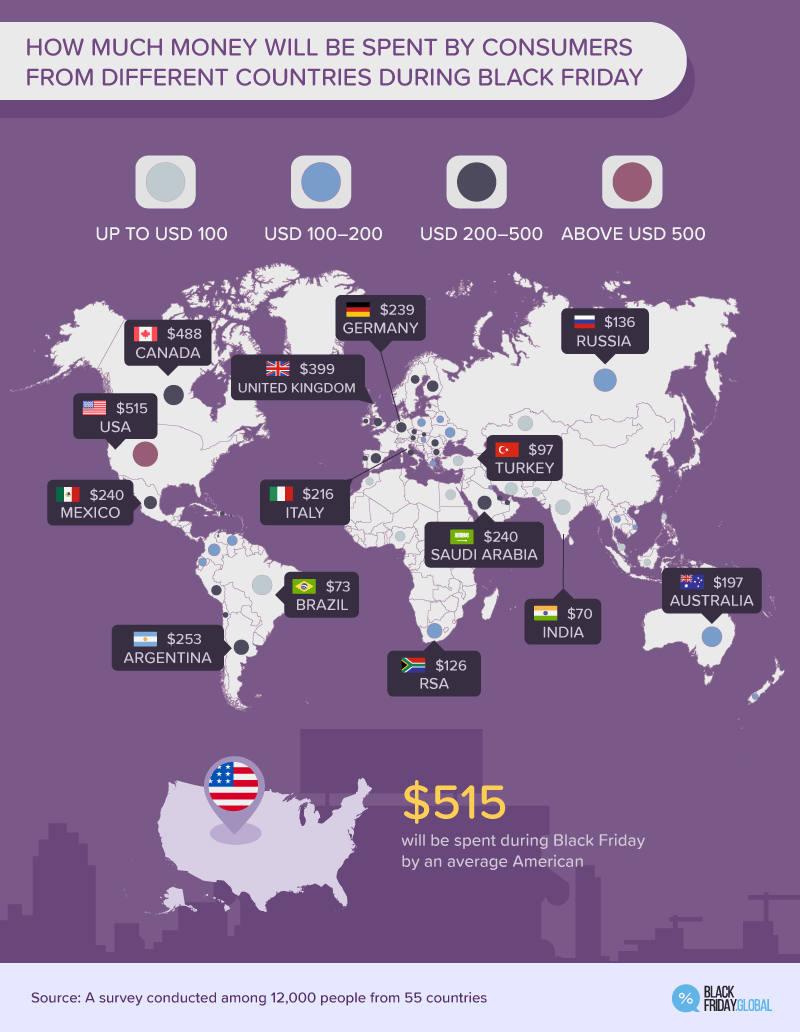
Here are the three highest and three lowest amounts consumers spend during Black Friday by country:
Highest:
- USA: $515
- Canada: $488
- United Kingdom: $399
Lowest:
- India: $70
- Brazil: $73
- Turkey: $97
Black Friday Vs. Cyber Monday Stats
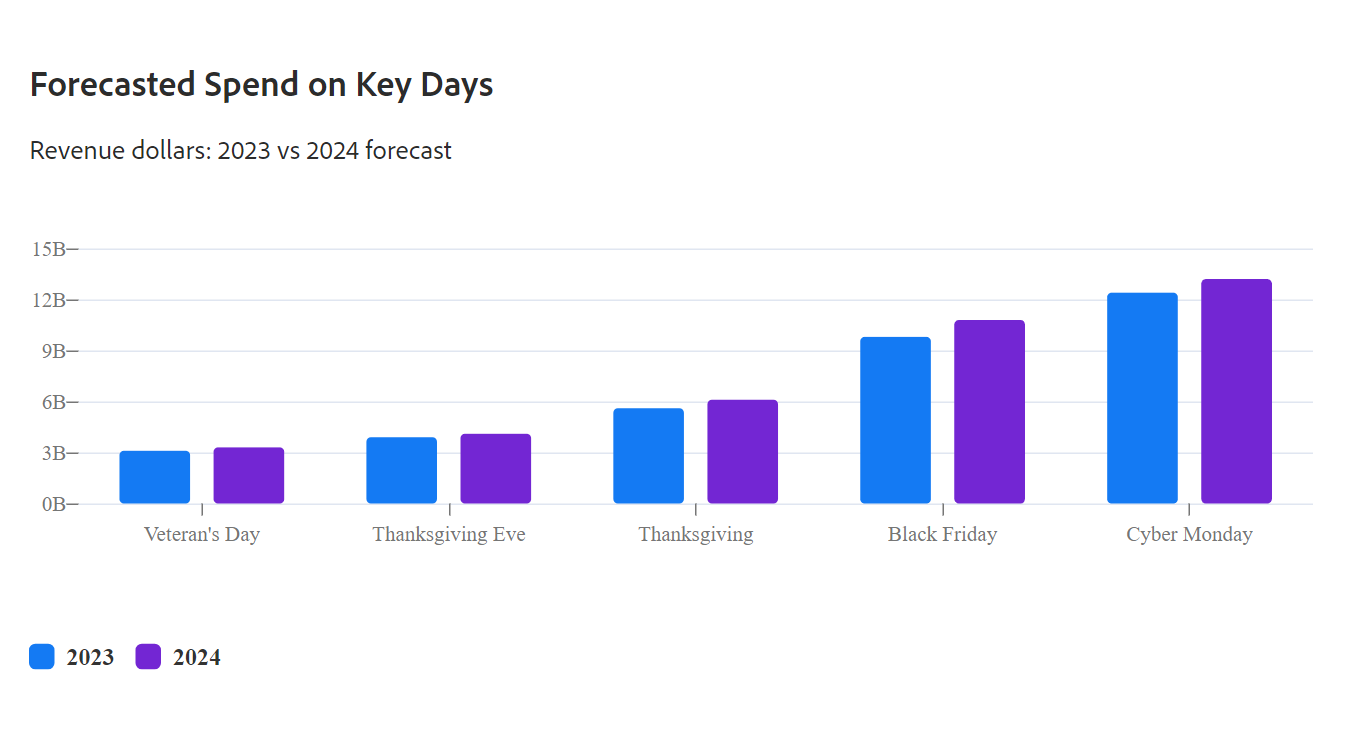
Black Friday might be the biggest sales day of the year. However, Cyber Monday sales stats have shown that consumers will spend more on that day compared to Black Friday.
- In 2023, Black Friday spending was forecasted at $9.8 billion, while Cyber Monday was expected to reach $12.4 billion.
- Moving into 2024, Black Friday spending reached $10.8 billion, whereas Cyber Monday climbed to $13.3 billion.
One of the key reasons Cyber Monday sales tend to outpace Black Friday is the higher demand for electronics and smartphones. Consumers often wait until Cyber Monday to snag deals on tech items, which are more commonly discounted on this day, making it a major contributor to the elevated spending.
Additionally, many online-only discounts are designed specifically for Cyber Monday, further driving its appeal to tech-savvy and deal-hunting shoppers.
Black Friday Statistics to Help You Succeed
Knowing the most important Black Friday and Cyber Monday stats will help you improve your seasonal digital marketing efforts, from your email campaigns to your social media endeavors.
As you’ve noticed, Black Friday was a holiday affected by the recent pandemic. As consumer trends change, businesses must adapt their marketing and sales strategies to respond to change more effectively.
So, whether you have an online business or a retail store, taking a moment to learn about the sales stats and trends of the previous years will work in your favor.
Now you are ready to rock this year’s Black Friday! Go!


