
Email Marketing Report Guide: Examples & Templates [2025]
An email campaign consists of three core elements: the idea, execution, and the email marketing report.
The last part is essential for your strategy, as it provides a way to track and analyze performance, ultimately optimizing your future campaigns.
In this article, we’re going to cover what an email marketing report is, how to create one, and the core metrics you need to track.
What is an Email Marketing Report?
An email marketing report is a spreadsheet or comprehensive dashboard that shows the key metrics related to your emails. It provides a clear picture of how well your email marketing campaigns are performing, helping you measure success and optimize your strategies.
It can track various performance indicators like your open and click-through rates, and help you come up with actionable insights. For example, it might reveal that emails with personalized subject lines have higher open rates, or that campaigns sent on Tuesdays perform better than those sent on Fridays. These insights can help marketers and teams make data-driven decisions.
If you’re starting with email marketing reports, keep in mind that they can be basic, pointing to the key metrics of an email marketing campaign. Or they can be custom reports, with data like “Top 10 customers” or “Best performing day and time.”
Lastly, an email marketing report can help you compare performance with previous campaigns or email marketing statistics and industry benchmarks. This will put your performance into perspective and help you identify trends over time, such as improvements in engagement or declines in open rates.
The Importance of Creating Email Marketing Reports
Email marketing reports are not just numbers on a screen. They’re key tools that help optimize your email campaigns and align your messages with your overall business objectives.
Reports matter because they help:
- Make data-driven decisions, instead of assumptions
- Visualize data for stakeholders
- Pinpoint trends and opportunities
- Align goals among teams
Let’s dive into more detail and explore some common use cases.
Making data-driven decisions
Email marketing reports provide useful data and testable hypotheses, helping marketing teams refine even the most subtle elements, like the color of a CTA button, the sender name, or an underperforming segment.
For example, an eCommerce store noticed that its email metrics had dropped below the industry average. Using an email marketing report template, they discovered that emails sent early Monday mornings had the lowest engagement, while Thursday afternoons worked best for all segments except for the 20–25-year-old demographic.
This insight helped them shift their primary send time to Thursday afternoons, excluding the underperforming segment. Instead, this group received targeted offers on Saturdays.
Demonstrating ROI to stakeholders
Email marketing might be the channel with the highest ROI, but marketing teams still need to prove its value to stakeholders. This makes transparent email marketing reports essential, as they provide visual evidence that email marketing actions can deliver measurable results and actionable insights.
Here’s a common use case: An agency used email reports to attribute $150,000 in monthly revenue directly to email campaigns. The report highlighted growth in the client’s subscriber list size and conversion rates from email links.
Presenting this data to the client helped the agency justify the marketing strategy by showing how email campaigns contributed to overall marketing performance.
Spotting trends and opportunities
Email reports reveal behavioral trends and shifts in engagement that open the door to new strategies and improvements.
For example, a travel agency tracked device usage via email reports and saw a steady increase in mobile opens. At the same time, they saw an unsubscribe spike and recognized that there was a problem with their email templates. This trend led the agency to use an email platform with mobile-responsive email templates.
As a result, this pivot increased click-through rates, improved bookings from email traffic, and decreased unsubscribe rates.
Aligning with broader marketing goals
Email marketing doesn’t exist in isolation. For campaigns to give results, they must align with the company’s overarching business and marketing objectives. Email marketing reports ensure this alignment by offering clear data on how email interacts with other channels, supports company goals, and contributes to the broader marketing objectives of a brand or company.
For instance, a retail chain combined email report data with loyalty program insights. They discovered that high-value segments responded better to exclusive product announcements and early access offers. Integrating this data into their broader customer engagement strategy resulted in an increase in purchase frequency among this segment.
Which Marketing Metrics to Track
As marketers, we’re all familiar with open and click-through rates. But effective email marketing reports go beyond surface-level stats. They focus on metrics that drive meaningful insights and contribute to your bottom line.
Here are the key email metrics to track and include in your email marketing report.
1. Open rate
Definition: The percentage of delivered emails that were opened by recipients.
Open rates indicate how attention-grabbing your subject lines are, how well you targeted each segment, and whether your audience is interested enough to engage. Open rates alone don’t drive business results, but they’re an early indicator of potential engagement.
2. Click-through rate (CTR)
Definition: The percentage of recipients who clicked on at least one link in your email.
CTR shows actual engagement with your email content. High CTRs indicate your message is relevant, and your call-to-action (CTA) is effective. It’s directly tied to traffic generation and lead nurturing, depending on the case.
3. Deliverability rate
Definition: The percentage of sent emails that successfully reach recipients’ inboxes, as opposed to spam or bounces.
If your emails aren’t reaching the inbox, your content has no chance to be seen. Tracking email deliverability helps you spot issues with list hygiene, sender reputation, or spam filters.
4. Conversion rate
Definition: The percentage of recipients who complete a desired action (like signing up or completing a purchase) after clicking on a link.
Conversions reflect the direct revenue impact of your email campaigns. A high conversion rate signals that your email content resonates and creates a seamless path from click to action.
5. Unsubscribe rate
Definition: The percentage of recipients who opt out of future emails.
This metric reveals audience dissatisfaction. High unsubscribe rates could indicate irrelevant content, too frequent emails, or poor targeting.
6. Bounce rate (hard and soft)
Definition: The percentage of emails that couldn’t be delivered. Hard bounces are permanent (e.g., invalid email addresses), while soft bounces are temporary (e.g., full inboxes).
A high bounce rate hurts sender reputation and deliverability. Tracking bounces ensures your email list quality stays high, and your campaigns reach real recipients.
7. Spam complaint rate
Definition: The percentage of recipients who mark your email as spam.
High complaint rates damage your sender’s reputation and can lead to deliverability issues. It’s important to monitor this metric to avoid blacklisting and ensure compliance with email best practices.
8. Revenue per email
Definition: The total revenue generated divided by the number of emails sent.
This metric shows the financial impact of each email, making it easy to compare campaign performance and prioritize what drives results.
9. Return on investment (ROI)
Definition: The revenue generated from an email campaign, excluding the total cost of its production.
ROI tells you whether your email marketing is profitable. It’s a key metric for securing stakeholder buy-in and justifying investment.
10. Engagement per segment
Definition: Analysis of open, click, and conversion metrics across different audience segments.
Not all subscribers behave the same way. Tracking engagement per segment lets you tailor your content and improve your targeting.
11. Performance by device or/and email client
Definition: Comparison of engagement metrics based on the device and email client used.
Understanding device and client preferences ensures your emails are optimized for the platforms your audience prefers. Poor mobile or client performance can hinder engagement.
Individually, each metric offers valuable insights. Together, they provide a holistic view of your email performance. They help you identify technical issues, refine targeting, improve engagement, and demonstrate business impact.
How to Create an Email Marketing Report
Creating an effective email report isn’t just a task to check off. It’s your opportunity to make data-driven decisions, justify budgets, and optimize your marketing strategy.
However, some reports are helpful, and others are full of unnecessary details. Here’s how to create one that drives results.
Understand why you need an email marketing report
Before diving into charts and metrics, be clear on the report’s purpose. It should serve a specific goal, like performance analysis.
Build one that looks like this template:

For this example, we have an eCommerce store that wants to measure the success of its latest transactional campaign. This email marketing report template shows all the core performance metrics for this campaign, including opens, clicks, unsubscribes, and bounces. They are essential if you want to know how successful your transactional campaign was.
After the metrics analysis comes the decision support: what should you test, optimize, or cut next? In our report, we can see that 66% of emails haven’t been opened. Perhaps the subject line doesn’t clearly indicate the transaction or is too bland altogether. This would be a hypothesis to test out and, later, optimize.
Another key purpose is stakeholder alignment. Your report shows the value of your campaign. This transactional email marketing report can be shared with team members as part of a brainstorming session for optimizing subject lines.
Lastly, your report supports strategic planning by showing how email performance contributes to broader marketing KPIs, such as customer retention, revenue growth, or conversion rates.
Building an email marketing report with Moosend
With email marketing tools like Moosend, you can choose between default report templates or fully customizable reports to match your needs.
To get started, log in to your account and click on “Campaign Reports.” As you can see below, each campaign comes with its own built-in reports:

Click on a campaign to view its dashboard, including key metrics and user actions.
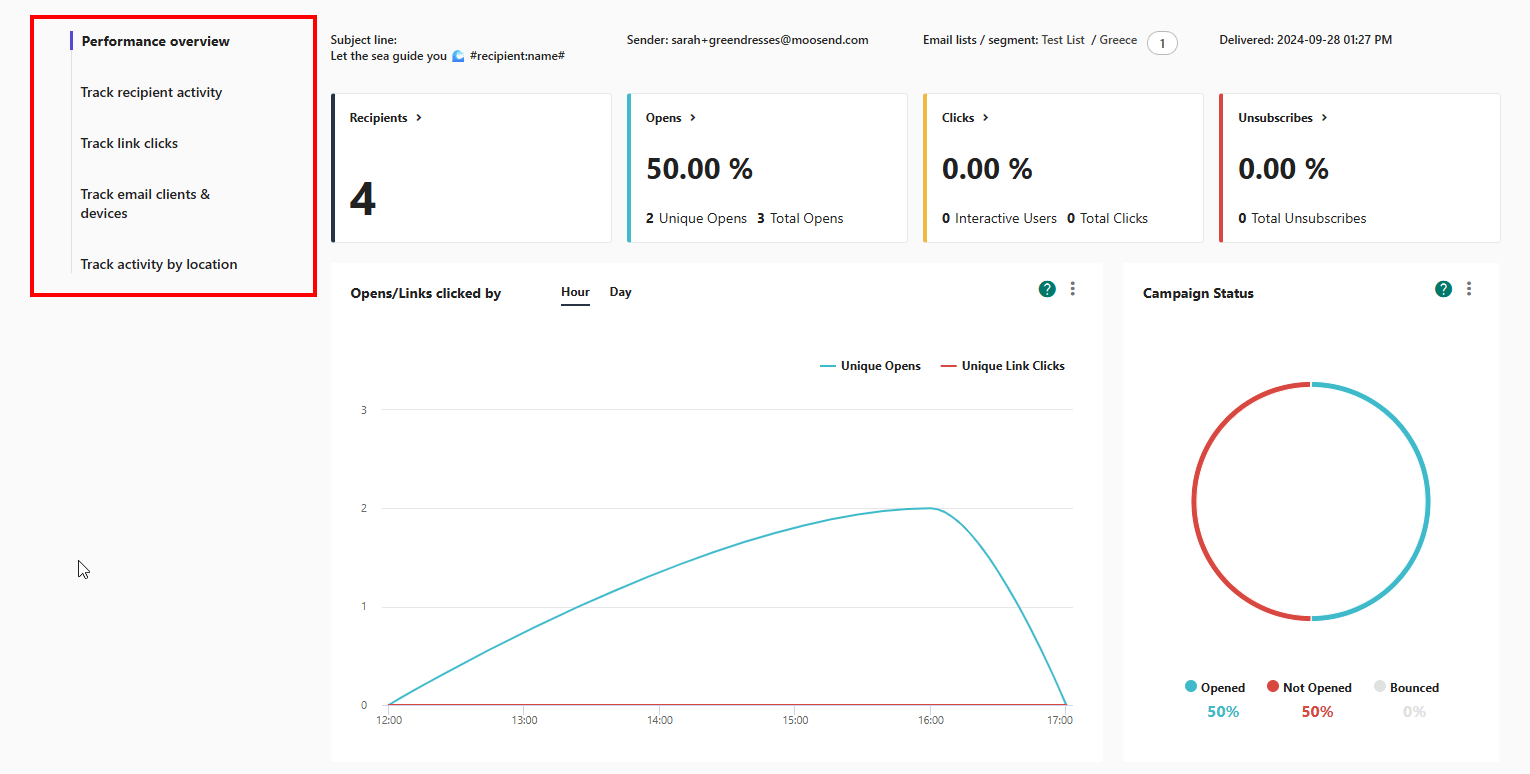
More specifically, you can:
- Track the overall statistics of your campaign through the performance overview.
- Understand how each recipient has interacted with your email through the “Track recipient activity” report.
- See how many times each link in your email has been clicked with the “Track link clicks” section.
- Optimize your email for the most popular email clients and devices with the data from the “Track email clients and devices” report.
- See how your campaign performs in various countries around the world with the “Track activity by location” report.
These built-in reports cover the basics. For deeper insights, head to “Custom Reports” in your dashboard and select the widgets that align with your specific goals.
For example, if you’re running a promotional campaign for your brand-new hotel, you can use a custom report to see which custom fields performed better, and target those contacts with an exclusive offer.
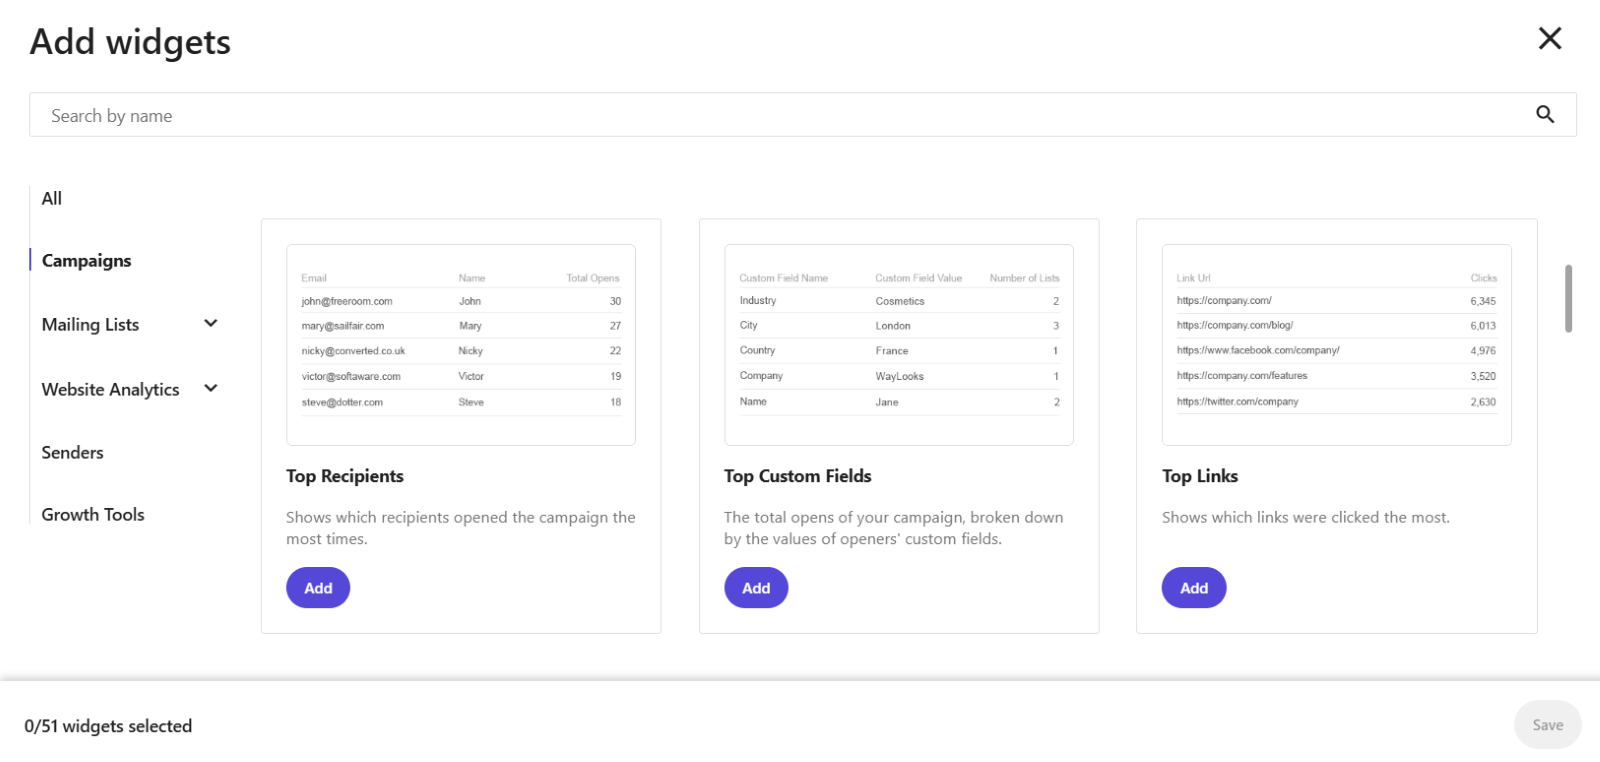
Want more granular data? Use ”Top Recipients” to see who opened your email most often, or ”Top Links” to find the most popular destinations.
You can select a widget from the following categories:
- “Campaigns” include widgets with information on your campaign’s performance.
- “Mailing lists” show you metrics extracted from your email lists.
- “Website analytics” display website statistics like visits and views. You need to connect your website to your account to use them.
- The “Senders” widgets display your top-performing senders.
- “Growth tools” display useful statistics about your lead-gen efforts.
Email Marketing Report Examples
As a marketer, you don’t need more dashboards, Excel sheets, or CSV files. You need clarity, which is what a well-structured email marketing report delivers.
Of course, well-structured can mean different things depending on your team’s goals. But there’s a rule of thumb. A good email marketing report goes beyond vanity metrics like open rates and focuses on data that drives real conversions.
Example A: eCommerce email marketing report
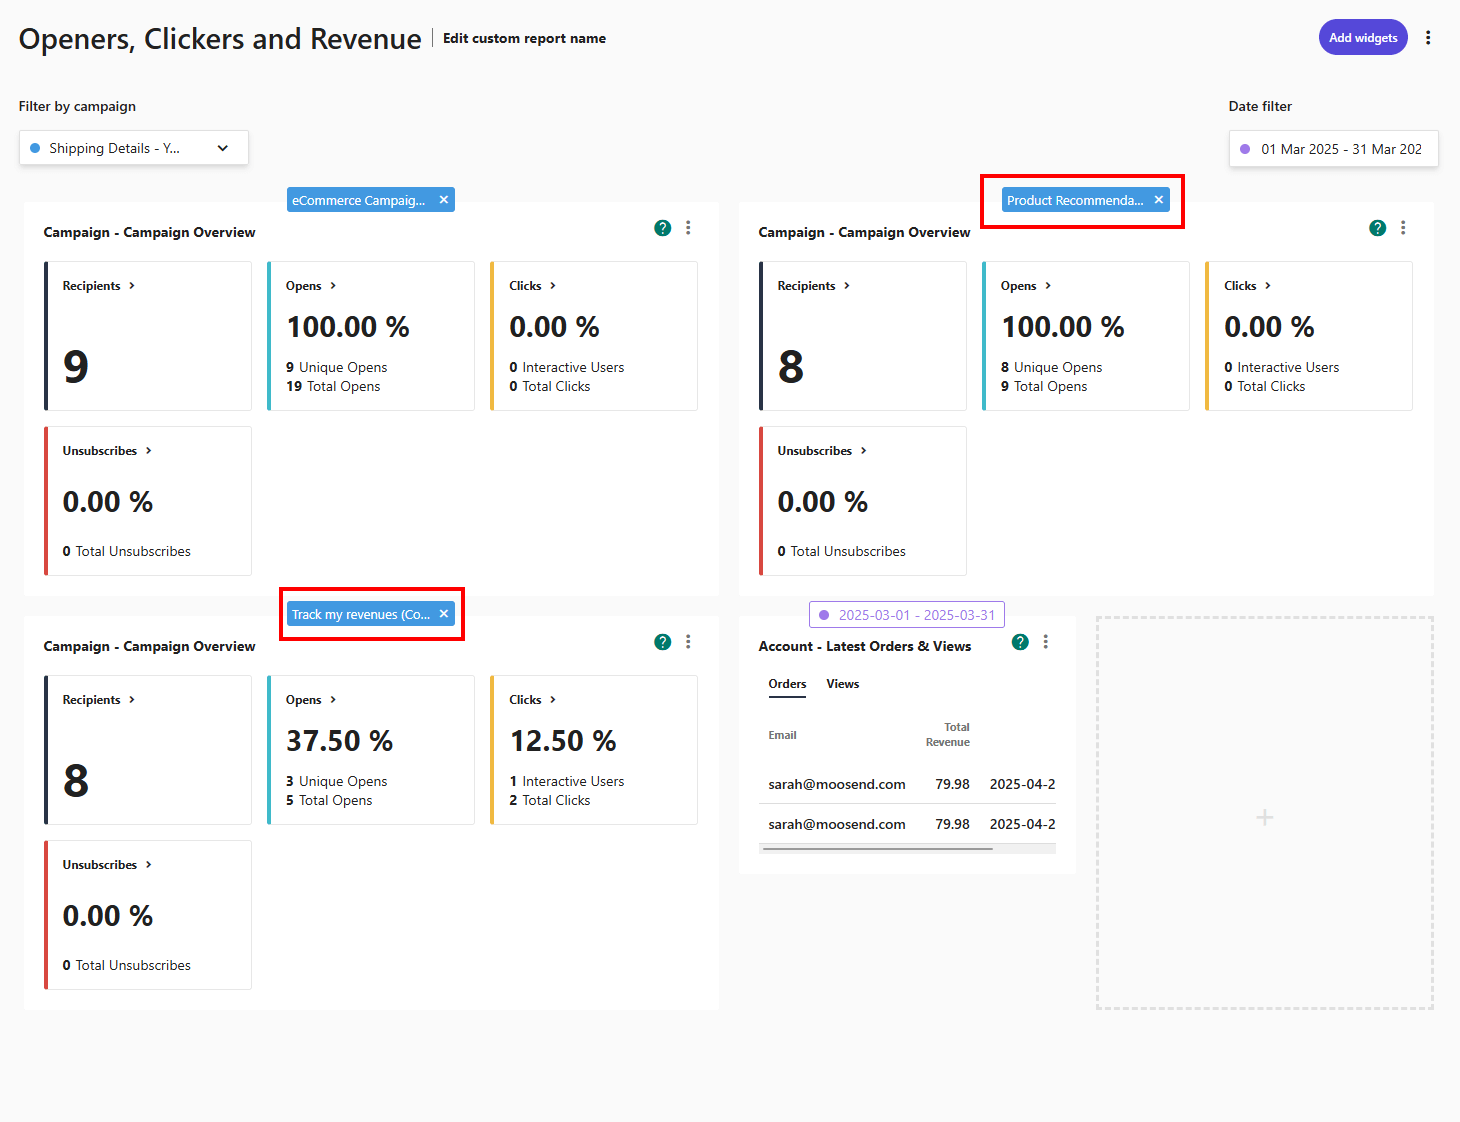
At a glance, this eCommerce brand report covers opens, clicks, and revenue, but it also goes deeper with metrics like product recommendations, latest orders, views, and revenue tracking.
What are the key takeaways of this report?
- There’s a 100% open rate but zero clicks in some campaigns, suggesting issues with copy, design, or targeting.
- The revenue attribution per client can help brands directly tie customers to their bottom line, allowing marketers to refine their strategies and target top-performing customers more effectively.
- It covers a specific time frame—a month in our case—which is a convenient comparison tool if you want to track your growth.
- Opens are measured both as a percentage and as a number, which means that anyone can understand what this number portrays.
Example B: Transactional campaign report
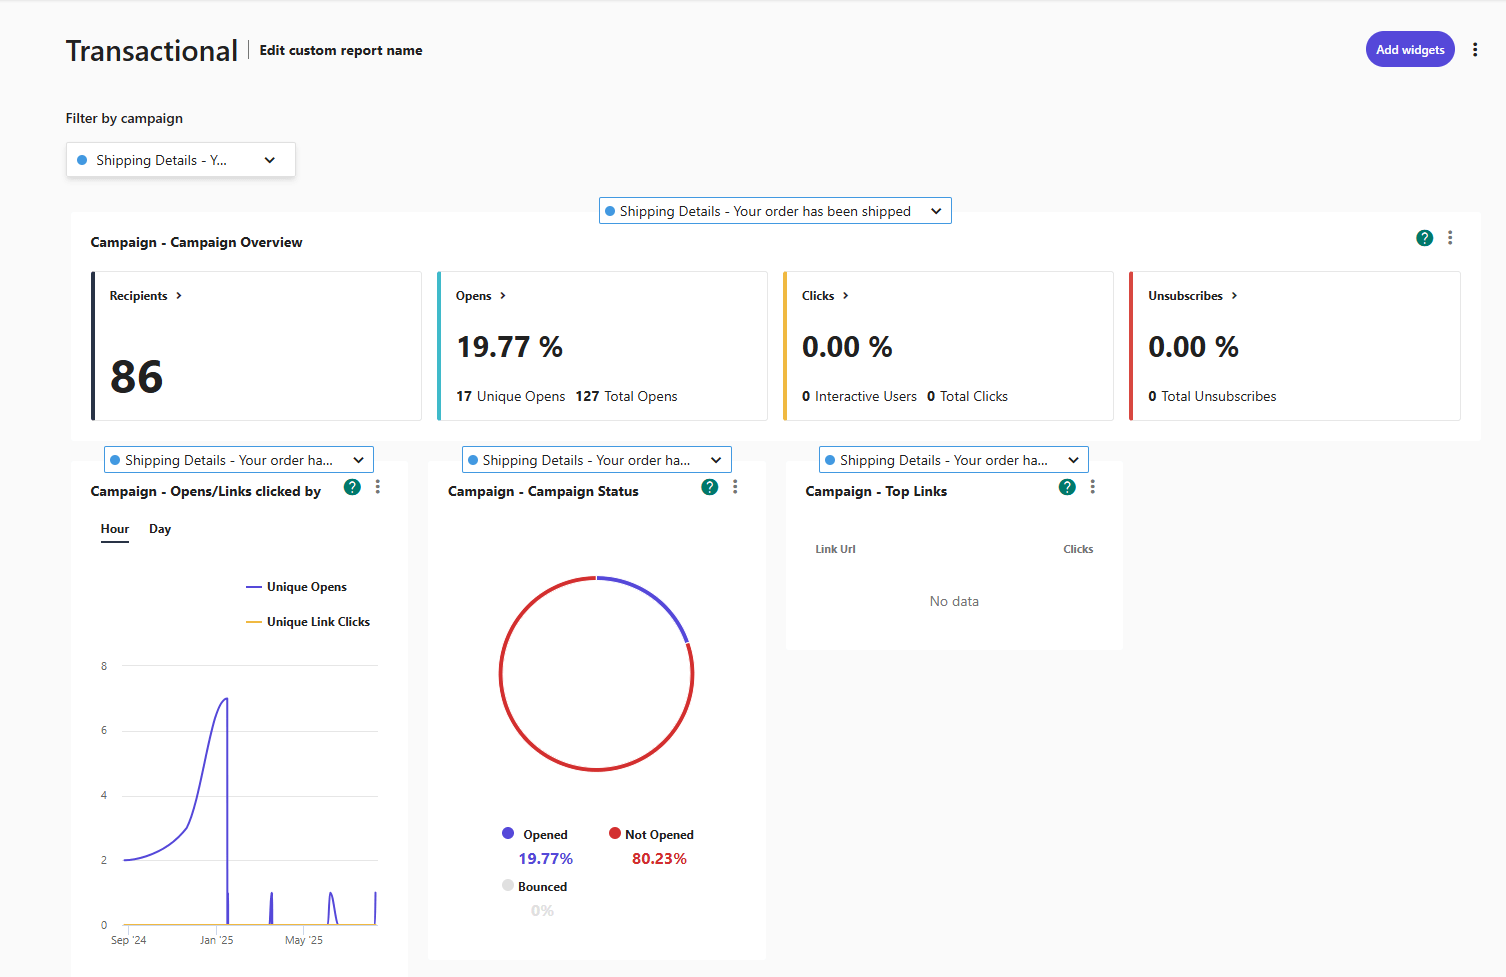
This transactional campaign is focused on shipping confirmation. While not sales-driven, transactional emails still offer valuable opportunities to build stronger customer relationships.
What are the takeaways from this report?
- The open rate is high, which is typical for transactional emails.
- The unique opens and total opens are also high.
However, there is a unique finding. The CTR looks a bit off for a transactional campaign. A rate of 0% could mean that:
- The CTA wasn’t clear or visible enough.
- The campaign was designed without a clickable action (a zero-click campaign), in which case a low CTR is expected.
You can fix such issues by adding clear, bold CTAs like “Track Shipment” or “Explore related items.”
Example C: A/B test campaign report
Another action you could take would be to run an A/B test campaign. In Moosend’s platform, an A/B test campaign comes with its own report:
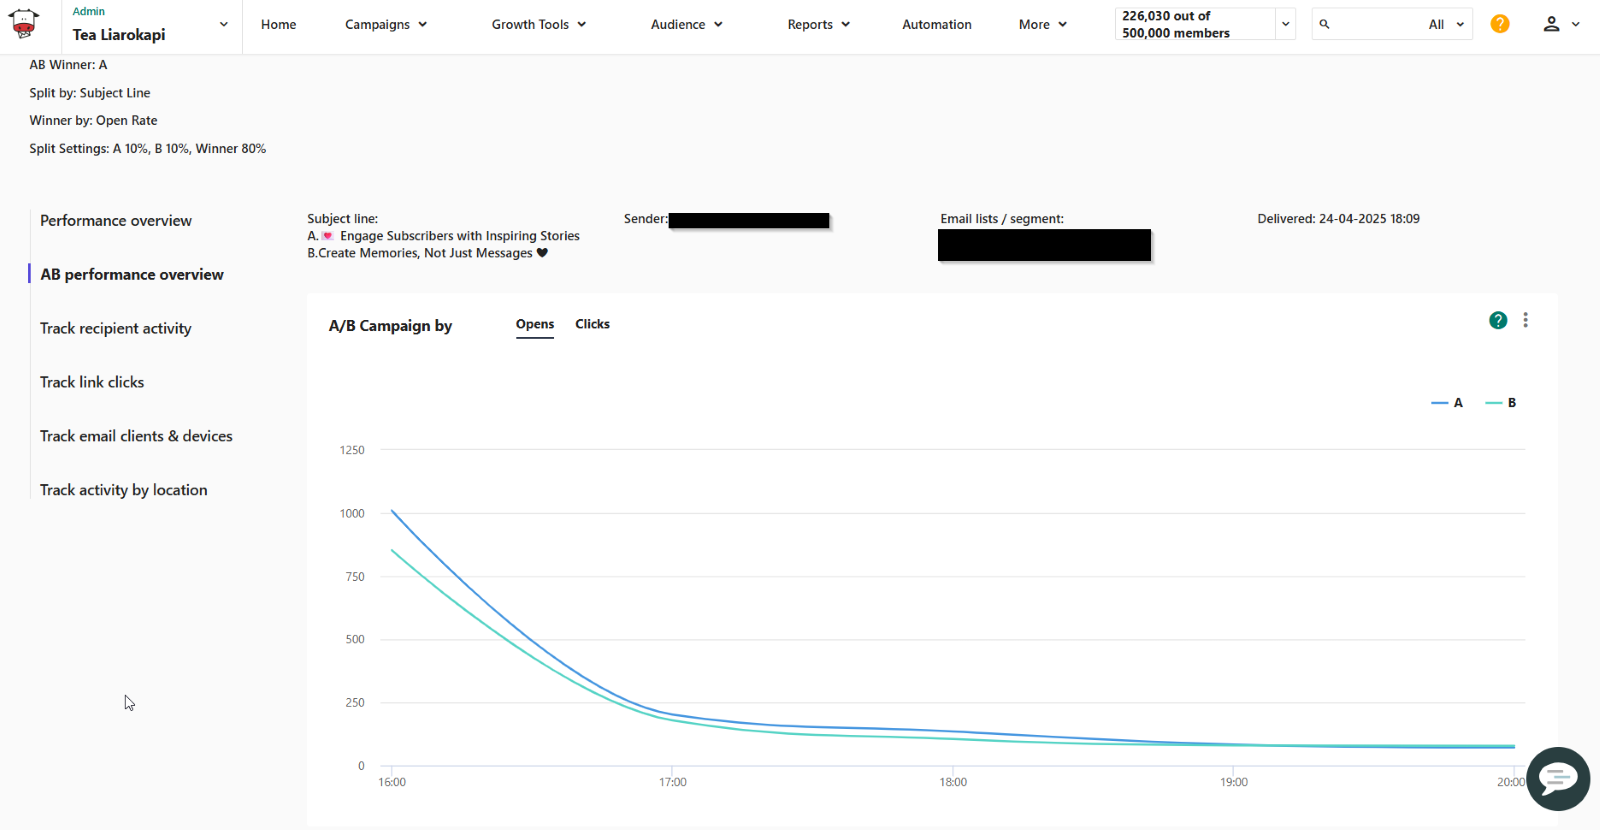
As you can see above, the A/B email marketing report shows comprehensive results split by opens and clicks.
If we scroll down a bit, we’ll see a full performance breakdown.

Here are some key takeaways from this report:
- Open rates are close between the two versions (20.81% vs. 19.18%), suggesting the subject line didn’t have a major impact.
- Click-through rates are very low in both versions (0.37% vs. 0.32%), which could point to unclear CTAs or content that didn’t encourage action.
- No unsubscribes were recorded in either version, a good sign that the campaign content was relevant or non-intrusive.
Email Marketing Report Templates
Juggling multiple campaigns, keeping in mind industry benchmarks, and catering to various audiences comes with some pains. A well-structured email marketing report template can be a powerful ally.
Instead of building your report from scratch every time, use the following templates to standardize your process, save time, and ensure you’re tracking the metrics that matter.
Performance overview
Use the performance overview template to evaluate the success of a specific campaign. Review the clicks by hour, day, or month, and benchmark your results against industry averages:
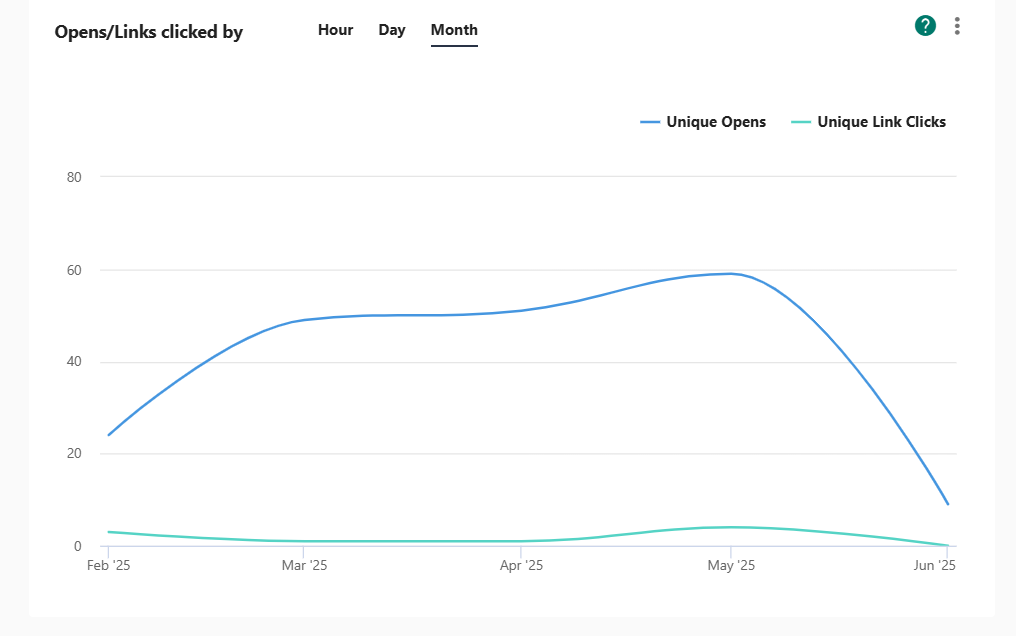
Tip: Use this email marketing report template after each campaign to quickly assess what worked and what didn’t. To make things more granular, add a widget that makes sense for your specific campaign’s needs, like ”Campaign Status,” that shows a donut chart with key metrics like opens and bounces, for easy visualization.
Track link clicks
This email report template shows you how your content performed; in other words, where your audience clicked the most and what stood out to them.
Tracking link clicks over specific time intervals can help uncover hidden content and activity trends.
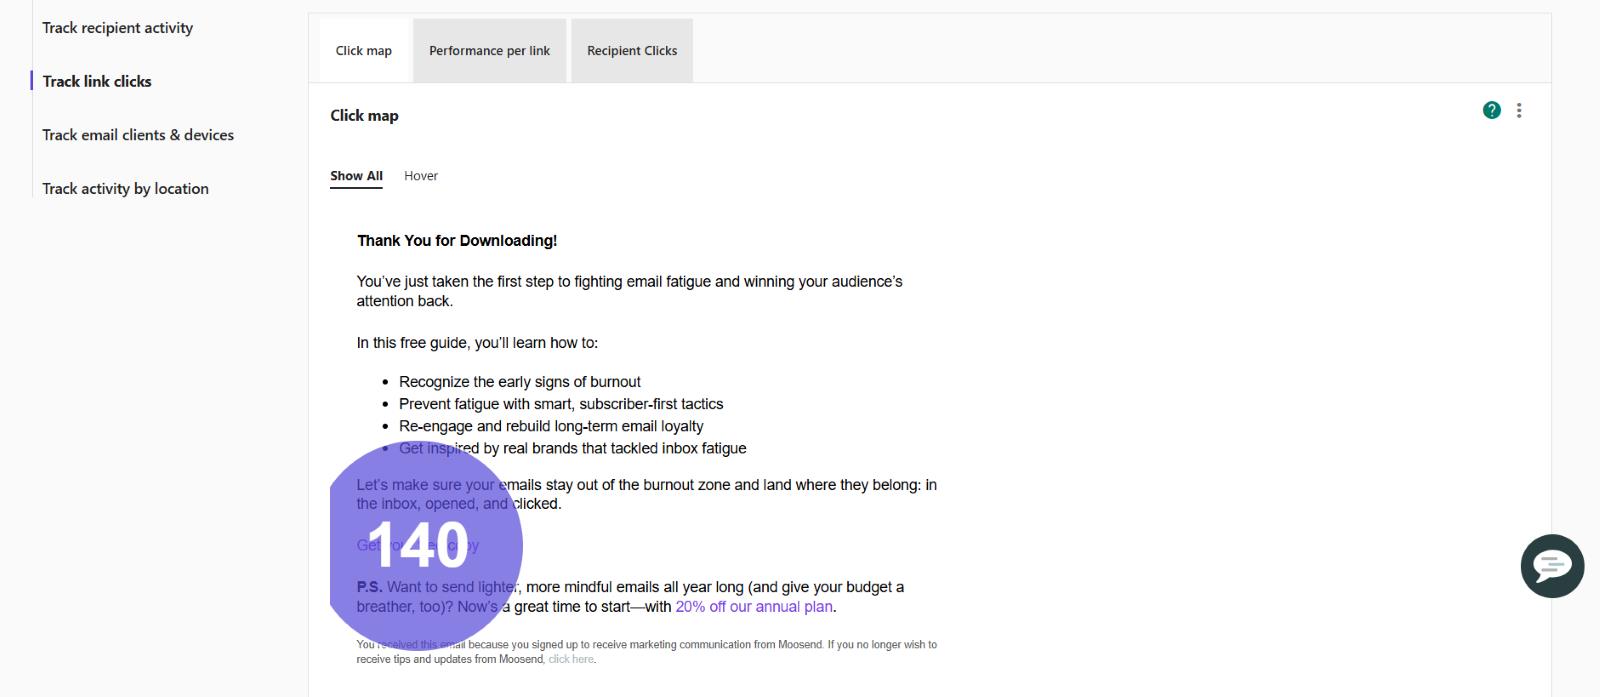
Tip: Download your report as a PDF or a CSV file or use Excel to store your data. Create month-over-month reports to spot patterns in engagement and user behavior over time.
Track recipient activity
The “Track recipient activity” template gives you insights into how individual recipients interact with your email campaigns.
This way, you move beyond broad averages and understand audience behavior on a more granular level.
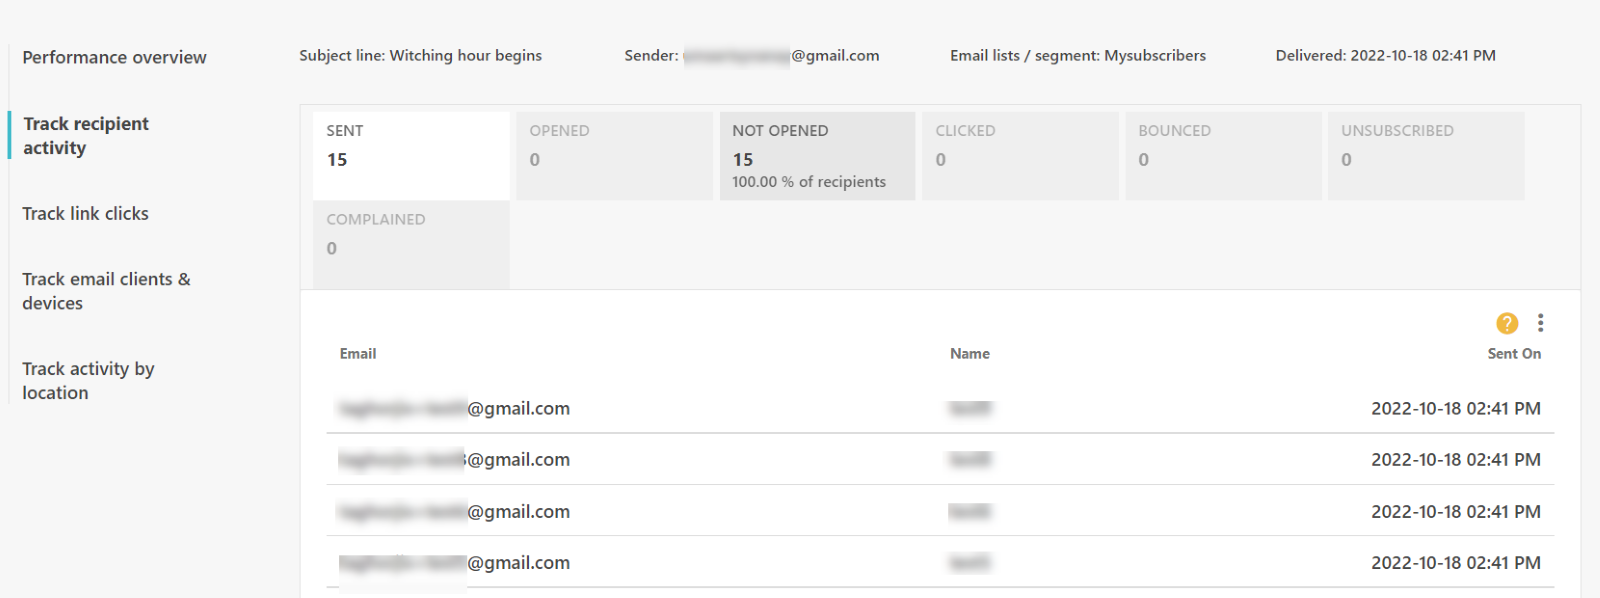
Tip: Pair this campaign template with the ”Top 10 Products for a Specific Member” widget to target each customer with tailor-made offers.
Track activity by location
This email marketing report template can give you insights into your brand’s best-performing regions. Great for brands with a global audience, it helps localize content, timing, and offers.
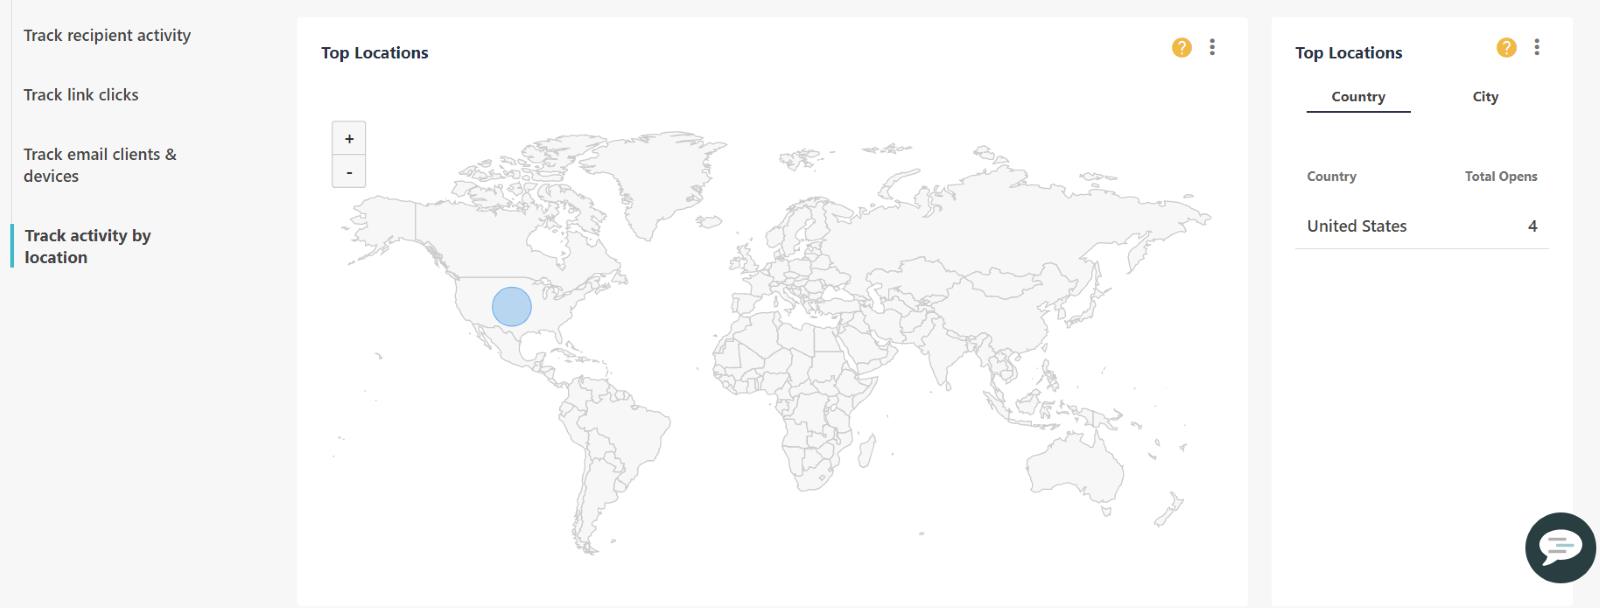
Tip: Pin down key holidays by region and tailor special campaigns. For example, plan offers around Diwali if India is your best-performing location.
Bonus Tips to Improve Your Performance
Reading reports is one thing. Interpreting them and taking action is where the real value lies. Building Excel files and benchmarking against your industry are smart habits. But those alone won’t move the needle.
Here are some insider tips to better understand your reports and improve your performance.
Create behavioral segments
Demographics can’t help you on their own. Along with them, track:
- The segments that clicked through but didn’t complete the action
- Recipients who didn’t open your email
- Those who didn’t convert at all
Then, use these micro-segments to send targeted follow-ups that speak to actual behavior.
Evaluate performance across your email sequence
When evaluating automated sequences, look beyond the overall revenue or performance. Pay attention to how engagement changes throughout the flow. This can reveal important insights about audience behavior.
For example:
- If engagement drops significantly after a few emails, your sequence might be too long or lose relevance. Consider trimming it or reworking the content to keep interest high.
- If a particular email sees unusually high clicks or conversions, analyze what made it effective. It could be the subject line, the timing, tone, or offer. Use those elements to strengthen the rest of the sequence.
- If the final emails underperform consistently, consider mentioning key messages earlier in the sequence to maintain impact.
Tracking these patterns helps you optimize for retention, engagement, and ROI, not just total output.
Creating Better Email Marketing Reports
Email marketing reports are more than just data in an Excel file or a dashboard on your email marketing tool. They’re your trusted decision-making assistants. The key is not just to read data, but to interpret it and take action.
Track your performance month-over-month or year-over-year, and across different campaign types. Meaningful comparisons, along with benchmarks, will help you spot trends and improve your campaigns.
Remember, email marketing reports are the starting point, not the end. Use them to create a better strategy, have a smarter execution, and achieve better results.



 Published by


 Published by