
Email Marketing Benchmarks By Industry, Region & Day [2026 Update]
Jonathan is a marketing specialist in the real estate industry and has been recently assigned to improve the company’s email marketing strategy. He sends his first campaigns, but when the results roll in, he isn’t sure what they really mean.
That’s a common problem. Email marketing can deliver great results, but “success” looks different depending on your industry and audience.
The good news is you don’t have to guess. Useful email marketing benchmarks are out there to help you see how your campaigns stack up.
In this guide, we’ve pulled data from sources like Mailchimp, Campaign Monitor, Klaviyo, Litmus, and MailerLite so you can understand what good performance looks like in your market.
Why Are Email Marketing Benchmarks Important?
Tracking metrics like open rates and click-through rates is key to knowing whether your emails are hitting the mark. But numbers alone don’t tell the whole story. Without context, it’s hard to know if a 20% open rate is great or if it needs work.
That’s where benchmarks come in. They show you what good looks like in your industry, help you spot areas for improvement, and give you a clearer picture of how you stack up against competitors.
To make the most of your data, you’ll want a platform that not only tracks results but also makes them easy to understand. With a tool like Moosend, for instance, you can dig into detailed reports, connect your data with tools like Google Analytics, and build custom dashboards that show exactly what matters to you.
Email Marketing Metrics by Industry
Below, we’ve gathered benchmark data from reliable sources and averaged the results to give you a clear picture.
Here’s how different industries perform.
| Open Rate | Click-through Rate | Unsubscribe Rate | Bounce Rate | |
| Advertising & Marketing | 28.99% | 1.62% | 0.12% | 0.27% |
| Agriculture & Food Services | 35.66% | 2.92% | 0.18% | 0.30% |
| Education & Training | 35.91% | 3.10% | 0.14% | 0.31% |
| Business & Finance | 35.13% | 2.21% | 0.16% | 0.35% |
| Government & Politics | 38.36% | 2.95% | 0.11% | 0.33% |
| Healthcare Services | 33.99% | 2.52% | 0.20% | 0.44% |
| IT/Tech/Software | 31.42% | 1.86% | 0.23% | 0.66% |
| Media & Publishing | 32.39% | 3.23% | 0.14% | 0.21% |
| Nonprofit | 40.39% | 3.46% | 0.10% | 0.41% |
| Other | 21.31% | 2.55% | 0.16% | 0.40% |
| Professional Services & Consulting | 34.11% | 2.28% | 0.17% | 0.54% |
| Architecture & Construction | 38.24% | 2.96% | 0.20% | 0.83% |
| Retail | 29.10% | 2.04% | 0.18% | 0.31% |
| Hobbies & Leisure | 40.12% | 3.55% | 0.16% | 0.21% |
| Wellness & Fitness | 35.29% | 2.84% | 0.26% | 0.32% |
| Real Estate | 31.15% | 2.08% | 0.15% | 0.36% |
| Telecommunications | 27.84% | 2.78% | 0.10% | 0.34% |
| Computers & Electronics | 27.91% | 2.11% | 0.14% | 0.46% |
| Manufacturing | 29.07% | 3.28% | 0.18% | 0.84% |
| Creative Services & Agency | 37.11% | 2.39% | 0.25% | 0.82% |
Here are some conclusions based on the data:
- Government & Politics and Nonprofit sectors have the highest open rates, while the lowest belongs to Telecommunications and Computers & Electronics.
- Nonprofit, Media & Publishing, and Hobbies & Leisure all achieve strong click-through rates, while Advertising & Marketing and IT/Tech/Software lag behind.
- Wellness & Fitness and Creative Services & Agencies show the highest unsubscribe rates, whereas Nonprofit and Telecommunications remain among the lowest.
- As for bounce rates, Government & Politics and Telecommunications maintain the cleanest lists, while Architecture & Construction struggles with high bounce rates.
Email Benchmark Metrics by Region
Now that we’ve learned how essential metrics vary by industry, let’s explore what happens for different regions based on a recent report by GetResponse:
| Opens | CTR | CTO* | Unsubscribe | Spam Complaint | Bounces | |
| North America | 23.53% | 3.86% | 0.1% | 0.1% | 0.01% | 3.42% |
| South America | 18.53% | 1.45% | 0.12% | 0.12% | 0.01% | 4.82% |
| Europe | 25.18% | 2.56% | 0.15% | 0.15% | 0.01% | 2.46% |
| Asia | 15.12% | 1.62% | 0.09% | 0.09% | 0% | 2.16% |
| Oceania | 19.59% | 1.57% | 0.11% | 0.11% | 0.01% | 1.75% |
| Africa | 16% | 1.05% | 0.09% | 0.09% | 0% | 1.95% |
| All | 19.66% | 2.02% | 0.11% | 0.11% | 0.01% | 2.76% |
*Click-to-open rate (CTO): measures the percentage of email openers who clicked on a link, showing how engaging your content was after the email was opened
Here are some key takeaways:
- The average email open rate is higher in Europe and North America.
- In North America, the average click-through rates are also high, and so is the bounce rate.
- In Europe, campaign performance is generally high, making emails one of the strongest marketing tools on this continent.
- South America has a low click-to-open rate and a higher average bounce rate than other continents.
Therefore, if you’re operating in different countries and regions, keeping track of that information is essential to optimize your email strategy accordingly.
Email Metrics by Day of the Week & Time
What are the most effective days to send emails to your subscribers and increase conversions?
Let’s see some data from Campaign Monitor:
| Opens | CTR | CTO | Unsubscribe | |
| Monday | 22.0% | 2.3% | 10.6% | 0.1% |
| Tuesday | 21.8% | 2.4% | 10.8% | 0.1% |
| Wednesday | 21.8% | 2.3% | 10.7% | 0.1% |
| Thursday | 21.7% | 2.3% | 10.7% | 0.1% |
| Friday | 21.6% | 2.2% | 10.1% | 0.1% |
| Saturday | 20.5% | 2.1% | 10.1% | 0.1% |
| Sunday | 20.3% | 2.1% | 10.1% | 0.1% |
As you can see, the differences are slight, with Mondays winning in terms of average open rate and Tuesdays in click-throughs and click-to-open rates.
But what happens with the send time of your campaigns? Look at the graph below to get a better grasp.
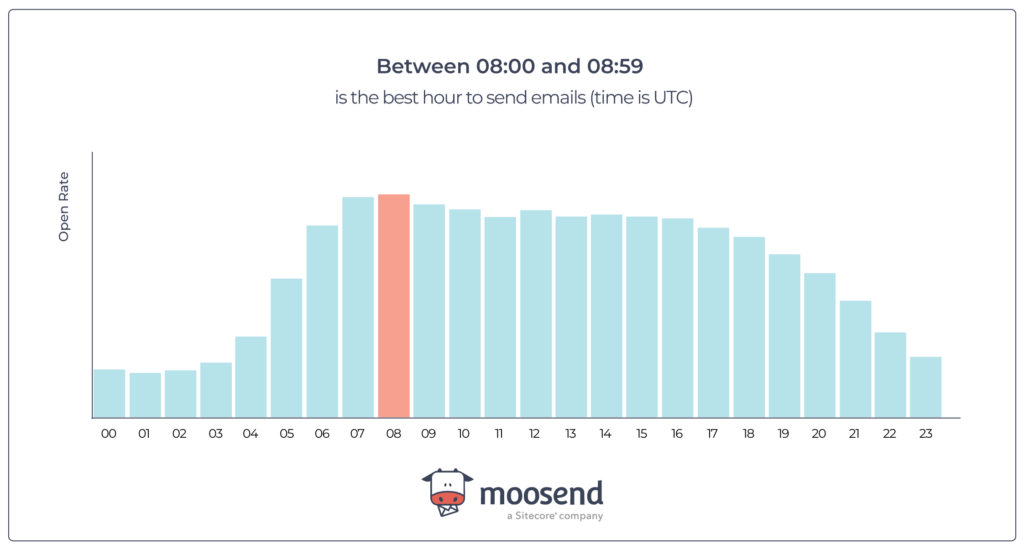
Here are three key takeaways to keep in mind:
- The highest open rates occur between 08:00 and 09:00, making it the optimal window to send campaigns.
- Emails sent before 05:00 see the lowest engagement, suggesting audiences aren’t active then.
- Open rates remain fairly strong from late morning until around 17:00 UTC, then gradually decline into the evening.
How to Improve Your Email Metrics in Simple Steps
Although the email marketing benchmark data shared earlier can be significant indicators for eCommerce and other businesses aiming to succeed in their email marketing strategy, every organization has a unique target audience with special reading habits.
Hence, to ensure that you’re always ahead of your competitors, here are some simple tactics to follow to sustain four of your most important email marketing metrics at a great level.
1. Open Rate
When it comes to driving opens, three factors matter the most: who the email is from, what the subject line says, and how the preview text supports it.
Subscribers are more likely to engage if they recognize and trust the sender, while a strong subject line helps them decide whether the message is worth opening. The preview text, though often overlooked, adds extra context and can give readers the final push to click.
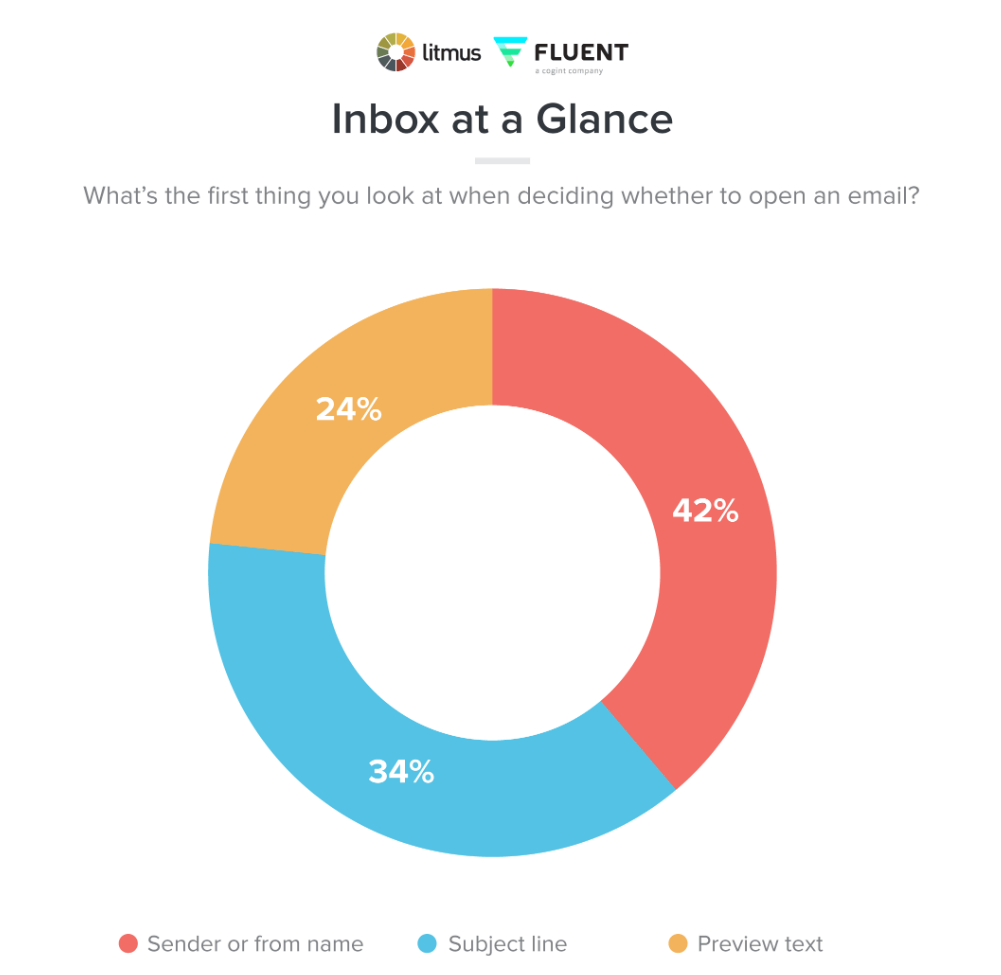
Here are a few tips to help you improve your open rates:
- Write a captivating subject line: Ensure it shows the value of your email content and personalize it if possible.
- Create a suitable sender’s name: Add a trustworthy sender name, including your brand or company name, to help email recipients recognize you faster.
- Use emojis cleverly: Make your email subject lines fun by adding relevant emojis to captivate your audience’s attention.
- Optimize your preview text: Write relevant content that complements your subject line and gives subscribers all the information they need to open the email.
- Conduct A/B Testing: Find which subject line or preview text version is best for your audience and deliver it to most subscribers.
- Schedule transactional emails: These timely email newsletters are triggered upon specific customer actions and, hence, receive high open rates.
By combining these best practices with industry benchmarks, you can strengthen the first (and most important) step of your email funnel, which is getting subscribers to actually open your messages.
2. Email Click-Through Rate
Now that you’ve succeeded in maintaining a good open rate, how can you motivate email recipients to click on your campaign and increase your conversion rates?
It starts with building interesting and relevant content that your readers will find enlightening.
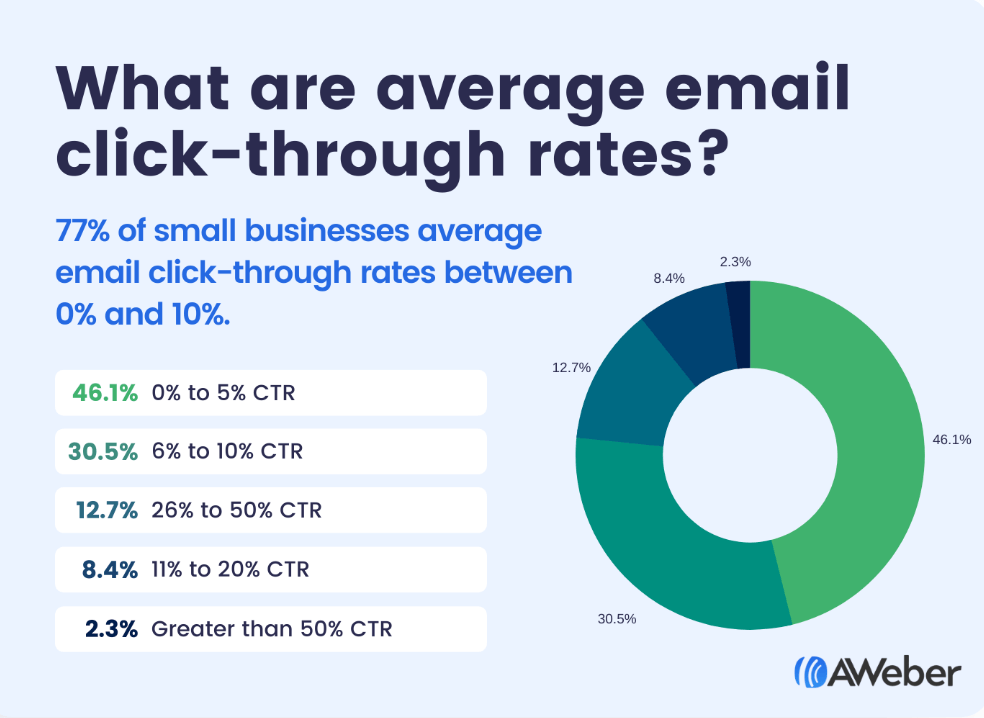
Here’s how to thrive in it:
- Write relevant copy: Create copy that consistently reflects your brand tone and use headlines for easier navigation.
- Mind your email design: Pick a ready-made email template with clear layouts and customize it based on your brand’s needs.
- Craft converting calls to action: Create CTA buttons that stand out from the rest of the text and are attractive enough to make readers click.
- Segment your email lists: Craft customized content for diverse target groups to increase engagement rates.
- Use dynamic content: Personalize content through marketing automation to cover your audience’s needs.
- Use images, GIFs, or videos: Make your email content more interactive with creative elements that complement your story.
- Add social media links: Invite your readers to social media platforms like LinkedIn or Instagram to nurture them further on a more frequent basis.
Pro tip: Ensure that the web and landing page you use offer a consistent user experience for your audience to avoid causing confusion or distrust.
3. Bounce Rate
Email deliverability is extremely important for keeping your email marketing engine running and your metrics healthy. To ensure that your emails land safely in your subscribers’ mailboxes, preserving the lowest bounce rates possible is essential.
There are two main types of bounces to be aware of.
- A hard bounce usually points to permanent issues, such as invalid email addresses or typos.
- A soft bounce, on the other hand, is often caused by temporary problems like a full mailbox. It can also happen if the receiving server blocks your email due to unmet requirements, such as DMARC, spam filters, or antivirus checks.
The first step to reducing bounce rates is regularly cleaning your email lists of invalid or inaccurate addresses.
Enabling a double opt-in process is also a great tactic. When new subscribers join your mailing list, ask them to verify their email address to proceed with their subscription.
In terms of DMARC, you can use a DMARC checker to ensure it has been set up correctly.
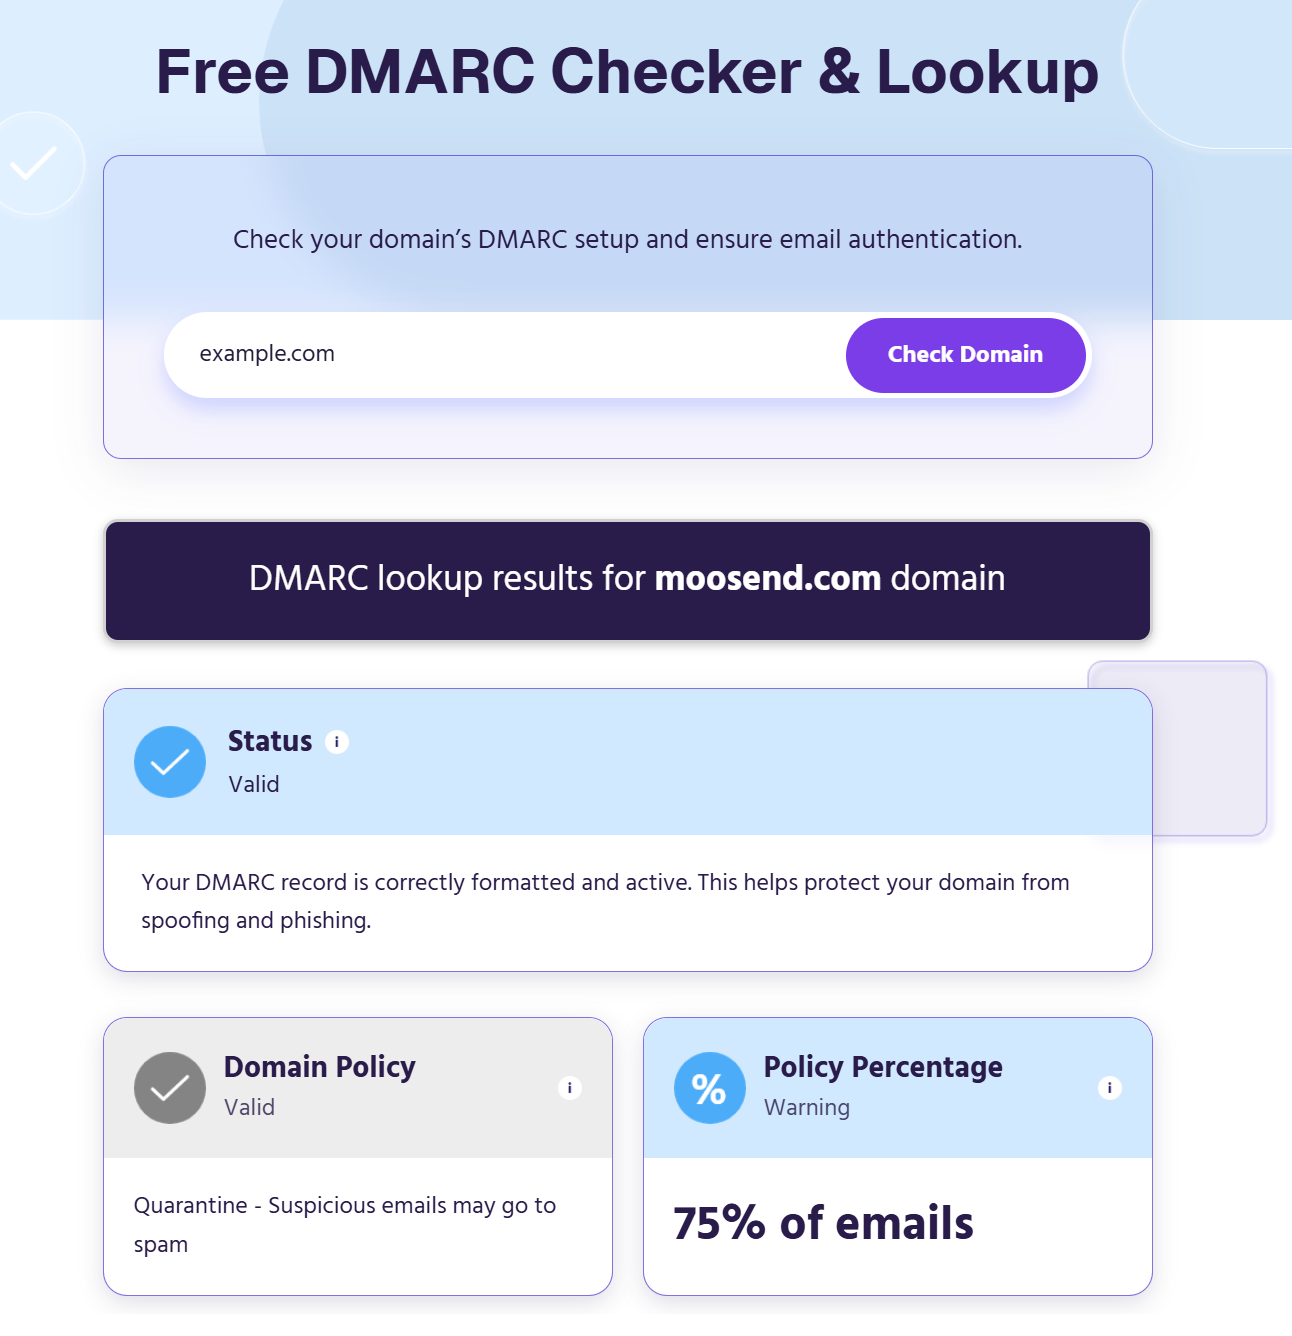
Moreover, authenticating your email domain will help you maintain a good sender reputation. So is avoiding spammy words and content that may signal to specific servers that your email belongs to spam.
Overall, using an ESP with a high deliverability rate like Moosend, which has a 98% record, will save you from trouble.
Check our periodic table below for more input on securing a high deliverability score:
4. Unsubscribe Rate
Spam complaints and unsubscribe rates are key indicators of how your audience perceives your emails.
Spam complaints happen when subscribers mark your email as spam, signaling that your content is unwanted or irrelevant. Unsubscribes occur when recipients opt out, showing they no longer find value in your messages.
High levels of either metric can hurt your sender reputation, lower deliverability, and reduce the overall effectiveness of your campaigns. Keeping them low ensures your emails continue reaching the inbox, protects your brand credibility, and helps you build long-term relationships with your audience.
Here are some tactics to implement:
- Offer a preference center to let users choose their content type and frequency, giving them control over their experience.
- Segment your audience to send targeted content based on demographics, behavior, or interests.
- Clean inactive contacts by running re-engagement campaigns or removing disengaged subscribers.
- Be transparent by reminding readers why they’re receiving your emails to reduce spam complaints.
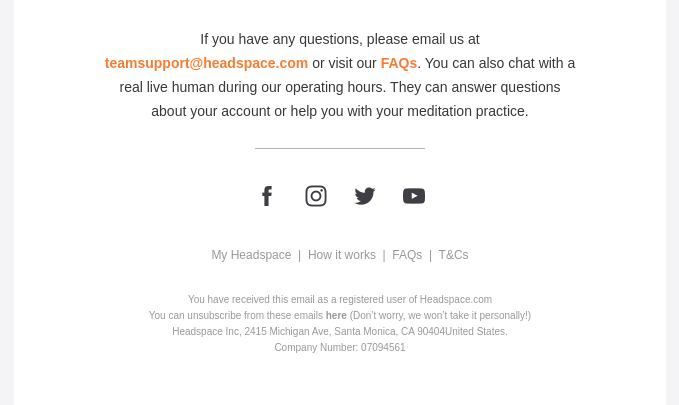
Finally, it’s wise to give them the option to unsubscribe if they want to by adding a dedicated button on your email footer. Empathize with their decision to opt out whenever they wish, as this helps avoid damaging your brand awareness in the long run.
Look at the example below by Headspace:
Additional Email Marketing Benchmarks
Beyond open, click, and bounce rates, there are other key metrics worth tracking to get the complete picture of your email performance.
These include:
- Conversion Rate: Measures the percentage of recipients who complete a desired action (like making a purchase or signing up) after clicking a link in your email. This shows how effectively your campaigns drive actual results.
- List Growth Rate: Tracks how quickly your subscriber list is growing over time. A healthy list growth rate means your campaigns continue reaching fresh audiences while balancing unsubscribes and inactive contacts.
- Revenue per Email: Calculates the average revenue generated for every email you send. This is especially important for eCommerce brands looking to measure direct financial impact.
- Return on Investment (ROI): Evaluates the profitability of your email marketing campaigns by comparing total revenue generated with the overall cost of your email strategy.
Monitoring these additional metrics ensures you’re not just focusing on engagement, but also on how email contributes to growth and revenue.
Here are some conversion rate averages across various industries:
| Average Conversion Rate | |
| Retail | 0.07% |
| Automotive | 0.06% |
| Computers & Electronics | 0.04% |
| Food & Beverage | 0.17% |
| Home & Garden | 0.05% |
| Health & Beauty | 0.11% |
| Jewellery | 0.05% |
| Office Supplies | 0.08% |
| Specialty Retail | 0.09% |
| Sports | 0.06% |
| Hobbies & Leisure (Toys & Hobbies) | 0.09% |
Also, according to the State of Email Report 2025, email marketing still offers one of the best returns on investment.
For every $1 spent:
- Many marketers earn $10–$36 back.
- Others see $36–$50 in return.
- A smaller group makes over $50 for every $1 invested.
Using Email Marketing Benchmarks
In short, tracking email marketing benchmarks will help you understand how your campaigns perform, particularly within your industry and specific regions. Learning what days and times give the best results will help you plan your email campaigns more wisely.
However, always keep in mind that every business is different. So analyze your buyer personas and customers in-depth to understand their habits and plan your email practices accordingly. Moreover, resort to A/B Testing when needed to clear the air. There is always room for experimentation until you find what resonates with your audience.
Looking for a first-class email automation solution with excellent reporting and analytics features? Sign up for a Moosend account today and start your free trial asap!
Email Marketing Benchmark FAQs
Ready for some quick answers to some interesting questions?
1. What is a good email open rate?
It depends on the industry and other factors, such as region or target audience, but it’s usually between 18-28%
2. What is a good CTR in email marketing?
An average email click-through rate is usually between 2-5%, but it varies based on the industry and region.
3. How can I improve my email open rates?
You can improve your email open rates by focusing on the elements subscribers see first. Start with a compelling subject line and a recognizable sender name to build trust. Add a clear and engaging preview text that complements your subject line instead of repeating it. You can also use tools like Refine by Moosend to test different versions before sending, and run A/B tests with your audience to learn what drives them to open more consistently.
4. What is a good unsubscribe rate?
A healthy unsubscribe rate is generally below 0.2%. Higher rates may indicate irrelevant content, too many emails, or poor list management.
5. What is an acceptable bounce rate in email marketing?
A good bounce rate should be under 2%. Anything higher suggests issues with list quality or missing authentication steps like SPF, DKIM, or DMARC.


 Published by

 Published by
