


Marketing Metrics: 73 Metrics to Get your KPIs in Order
Published By Tea Liarokapi
January 7, 2025

07/01/25
Someone new starting in your marketing team, share this article with them about the marketing metrics they should look out for.
We got your back.
And if you do not have the time to read the whole article you can get the full encyclopedia in your inbox.
Marketing Metrics for eCommerce Lovers

Customer Retention Rate (CRR) | Customer Acquisition Cost (CAC) | Customer Lifetime Value (CLTV) | Average Revenue Per User (ARPU) | Monthly Recurring Revenue (MRR) | Annual Recurring Revenue (ARR) | Churn Rate | Net Revenue | Net Promoter Score (NPS) | Product Views |
1. Customer Retention Rate (CRR)
What is customer retention rate?
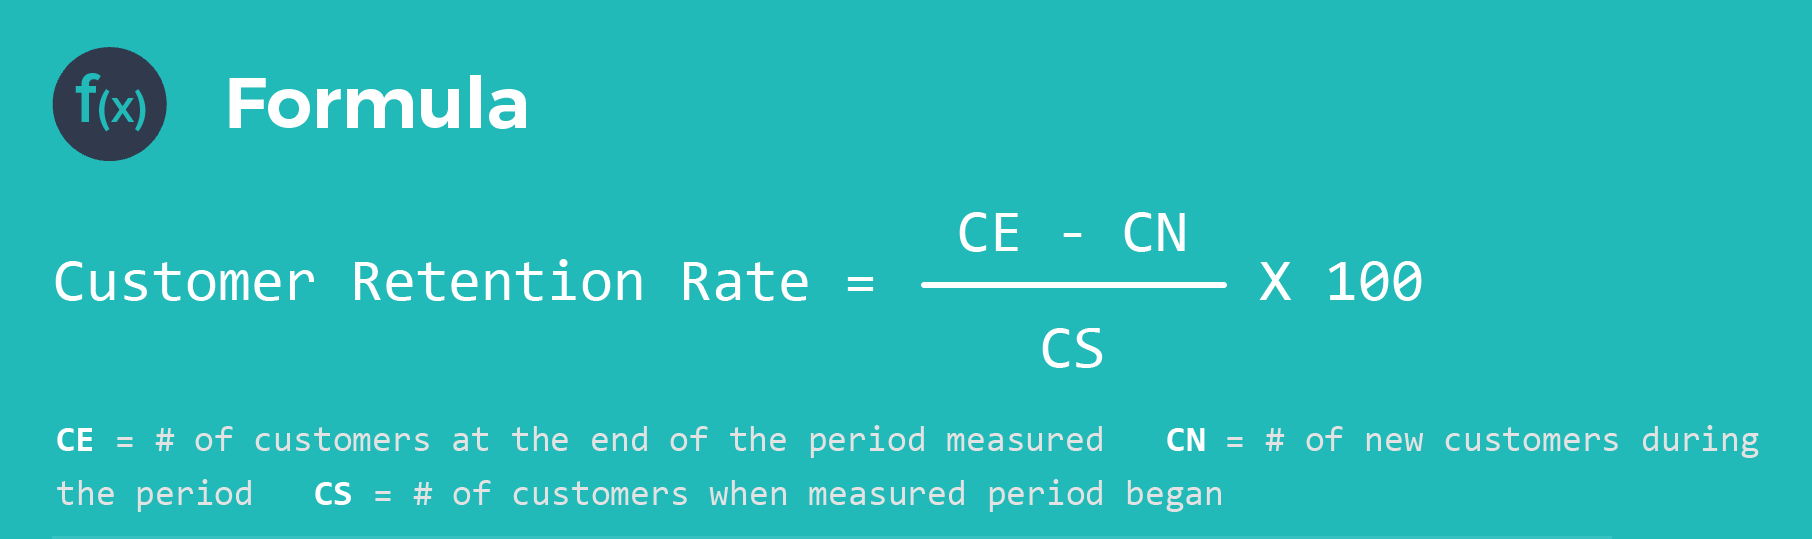
CRR or Customer Retention Rate is the percentage of customers that stay loyal and interact with your brand during a specific time period.
More specifically:
The CRR is the opposite of churn rate: churn rate looks at the rate at which we lose customers.
CRR, on the other hand, looks at the rate at which you manage to retain customers.
To calculate the CRR you will need the following:
- Start with the number of customers you have at the end of the period
- Subtract the number of customers you acquired during that period
- Divide the result by the number of customers you had at the beginning of the period
- Multiply by 100 to estimate the percentage of CRR
What is a good customer retention rate?
It depends on your industry. However, there is a general rule of the thumb here: Your CRR should be steady during the selected time period or, ideally, it should be going upwards, as opposed to your customer retention rate. Here are some interesting customer retention stats.
2. Customer Acquisition Cost (CAC)
What is Customer Acquisition Cost?
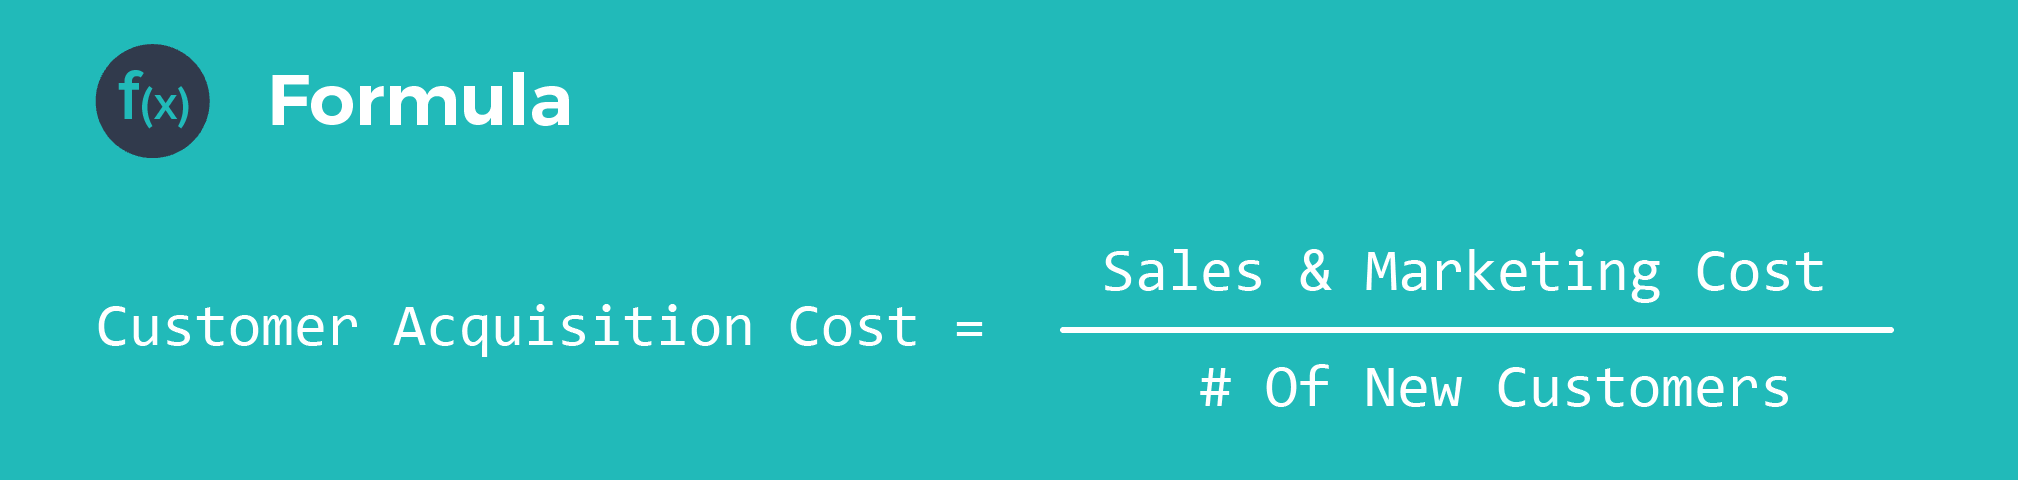
Customer Acquisition Cost (CAC) is an important marketing metric that shows you the amount of money a company needs to spend, in order to convince someone to become a customer.
More specifically:
Customer acquisition corresponds to the total cost of acquiring new customers (ads, sales, marketing) divided by the number of customers acquired.
The CAC is the less popular one compared to CRR because retaining customers is always more cost-effective and strategic than acquiring new ones. But no matter the popularity, it’s very important. Why? Well, when you know your CAC rate, it is easier for you to budget for your marketing actions and see which of them are more beneficial.
What is a good CAC rate?
Industry-wise, there are plenty of answers. In general, the lower your CAC rate in correlation to the CLTV (see below), the better.
Read more about the Customer Acquisition Cost (CAC)
3. Customer Lifetime Value (CLTV)
What is customer lifetime value?
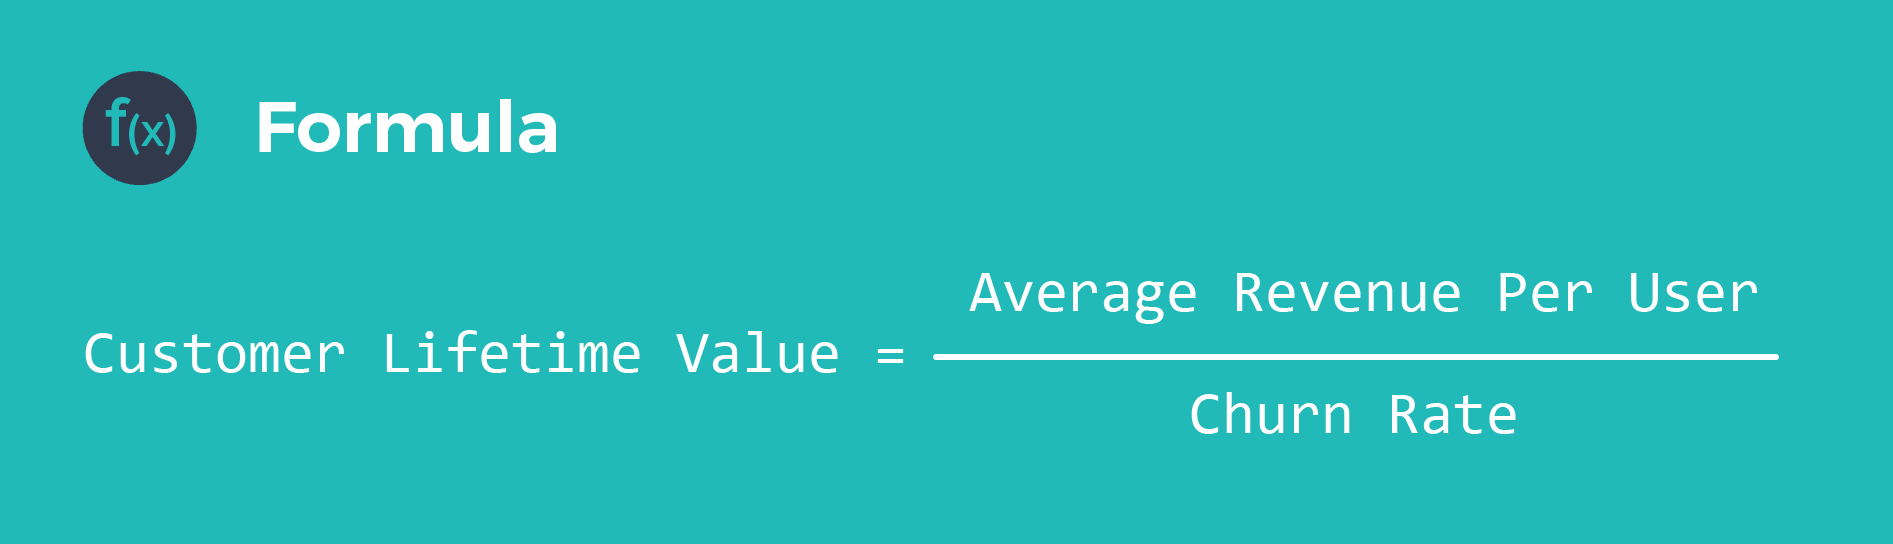
Customer lifetime value (you may also see it referred to as lifetime customer value or lifetime value) is the net amount of profit expected by each customer, over their “lifetime” as your customer.
More specifically:
To arrive at customer value, you need to multiply the average purchase value by the purchase frequency.
As soon as you are looking at customer value numbers, multiply that with the average customer lifespan to add your CLTV to your spreadsheet and that’s how you calculate CLV.
What is the average purchase value? Multiply that by the average purchase frequency and then multiply that with your average customer lifespan.
Regarding PPC, CLTV is used to evaluate and compare the CLV of a PPC acquired customer with other channels.
This can help you with understanding the quality of customers coming in from PPC campaigns. But let me tell you another thing you should definitely know about this metric and how it correlates with Customer Acquisition Cost (And feel free to re-read the section above, too!)
What is LTV:CAC?
The ratio of lifetime value to customer acquisition cost is a pointer to use for understanding what we should be spending to acquire a customer.
For a profitable and sustainable business, your CAC has to be smaller than CLTV.
That is, the cost pertaining to acquiring new customers should be smaller than the revenue that you expect to generate from the customer over a given time period.
What is a good CLTV rate?
Ideally, you want your customer to be a customer for life and to trust your products and services alone. But in terms of numbers, you’ll always need the CLTV to be bigger than the CAC.
Check also here some additional customer satisfaction metrics!
4. Average Revenue Per User (ARPU)
What is the Average Revenue Per User?
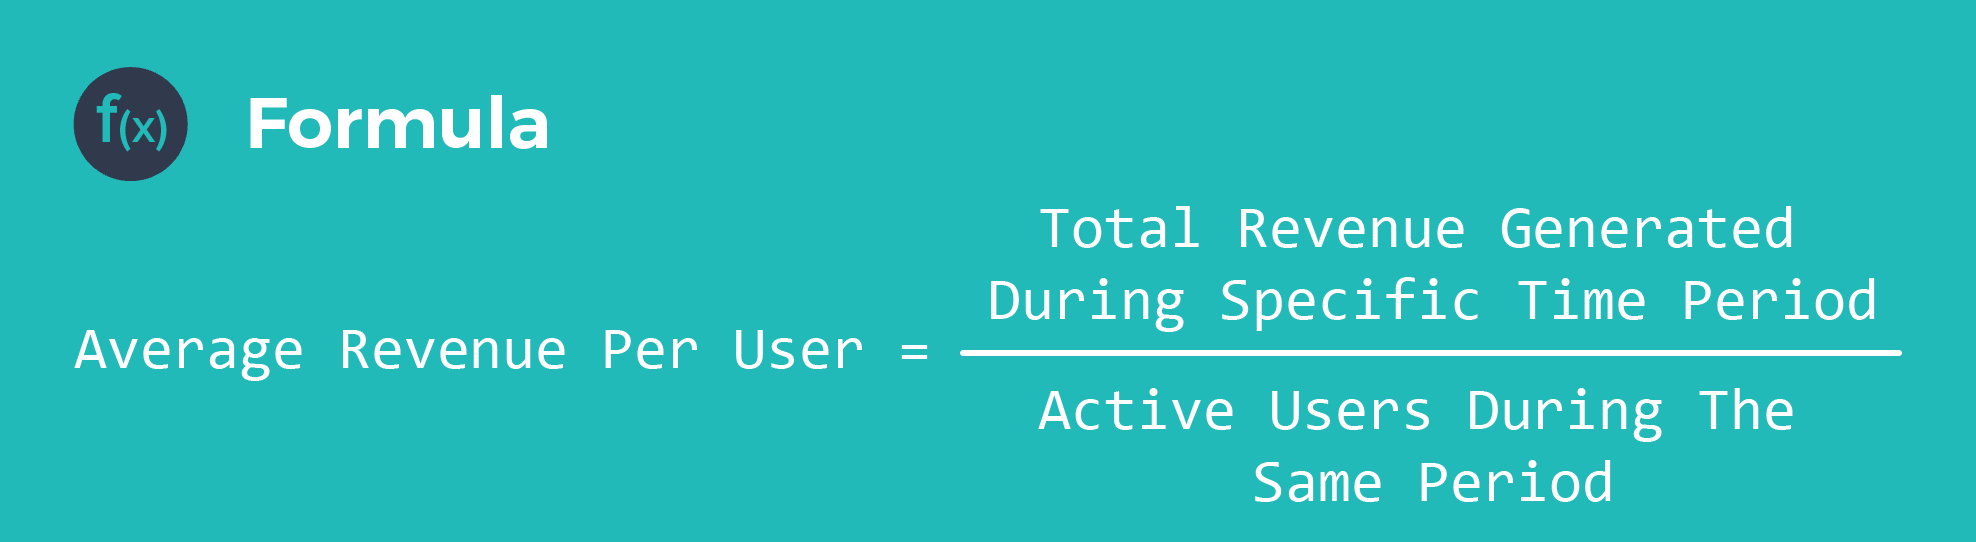
The Average Revenue Per User (ARPU), also known as Average Revenue Per Unit, is the revenue generated per active user/buyer or per unit.
More specifically:
In order to figure out what your ARPU is, you’ll need to divide the total revenue by the average number of users during a specific time period. So, you’ll need to determine the time period you’d like to test for.
This metric allows companies to test and have a clear picture of the revenue generated and how effective the techniques used to generate that revenue really are.
What is a good ARPU rate?
This will have to be by industry standards, as is the case with most-if not all-marketing metrics.
5. Monthly Recurring Revenue (MRR)
What is the Monthly Recurring Revenue?
MRR is a marketing metric that calculates the expected revenue by recurring customers per month.
More specifically:
This marketing metric is mainly used by subscription-based products or services (e.g. subscription boxes, gyms, etc.). This is one of the marketing metrics that can help you predict your revenue stream and normalize your monthly performance.
So, you will need to multiply the number of customers by the average amount of money they pay per month.
It’s obvious that this is one of the most important marketing metrics for a subscription-based business, and it can be one of the most difficult to raise as well. Just don’t fall into the traps of giving out too much for free or not trying to upsell and cross-sell wherever possible, and you’ll do just fine!
What is a good MRR rate?
The more, the merrier! Ideally, you need zero churn rate and continuously increasing customers, which will definitely take a while, so be patient.
6. Annual Recurring Revenue (ARR)
What is the Annual Recurring Revenue?
ARR, or Annual Recurring Revenue, is the income generated annually during a subscription’s lifespan.
More specifically:
ARR is the annual recurring revenue and is equal to the monthly recurring revenue multiplied by 12-for the months, that is. It applies, as you probably have already guessed, to subscription-based services, much like the MRR.
Increase that ARR with loyalty programs, coupons, and rewards. And don’t forget that word of mouth is a fantastic way to increase pretty much everything!
What is a good ARR?
A good Annual Recurring Revenue is an Annual Recurring Revenue that will spark joy!
7. Churn Rate
What is a Churn Rate?
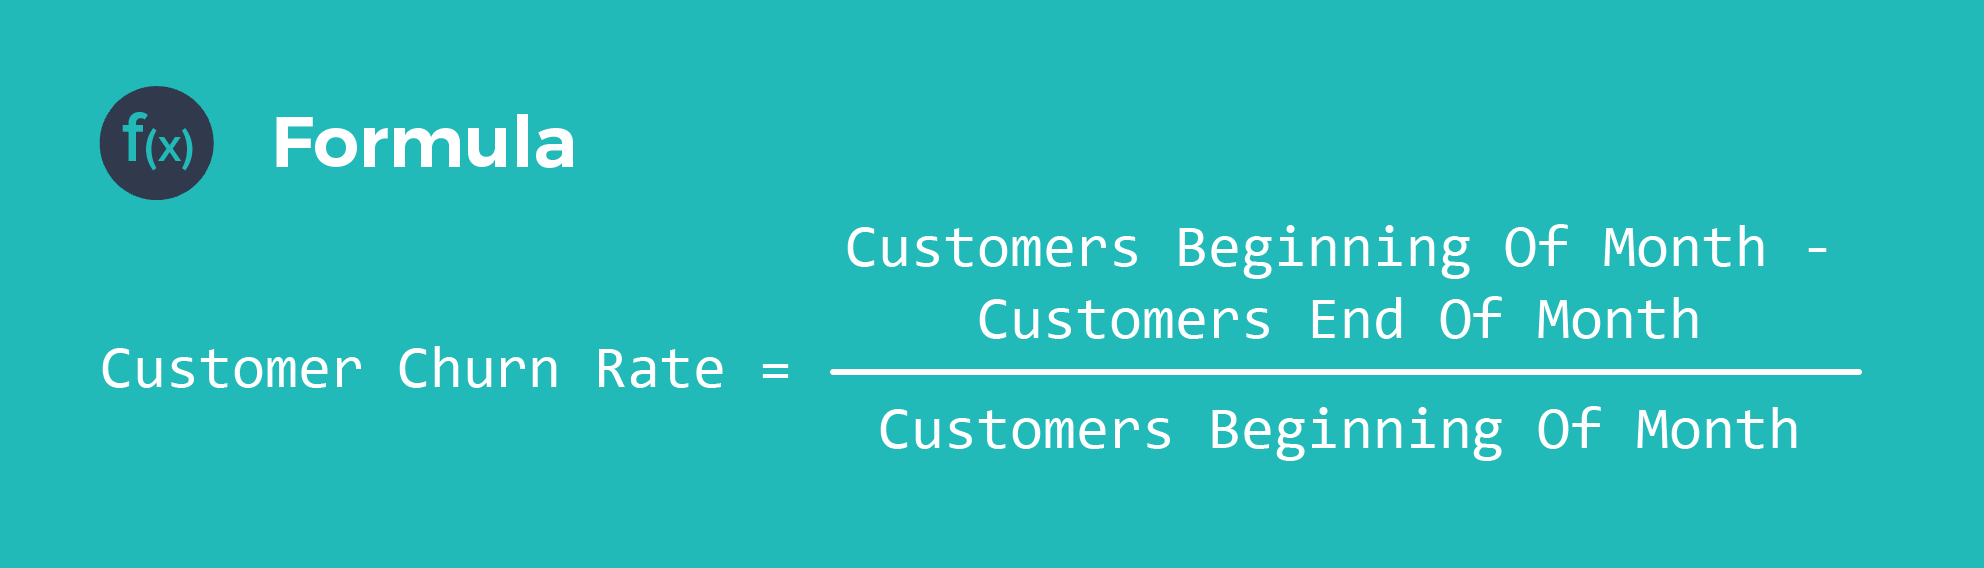
Churn rate refers to the pace at which businesses lose customers within a specific time frame, e.g. monthly or annually.
More specifically:
To estimate your monthly churn rate you need to start from the number of customers at the beginning of the month.
Subtract the number of customers remaining at the end of the month, and then, divide by the number of customers at the beginning of the month.
To arrive at your annual churn rate, multiply the number above by 12.
What is a good churn rate?
Zero! What? You asked! Anything close to zero is acceptable and sustainable. And realistic, most of all.
Think of your business and losing one out of 100 customers every month.
And since we talked about how retaining your customers is more efficient than acquiring new ones, growing your business at a rate that is faster than churning customers is not a viable solution.
8. Net Revenue

What is Net Revenue?
Net revenue is the amount of income a business makes after subtracting the discounts, returns, bounced checks, etc. from the total amount.
More specifically:
Net revenue is a top-line metric, as it doesn’t take into account some other key parameters. At this point, let me clarify that net revenue is one thing, whereas net income is a completely different issue. Net income is what you’ll get if you deduct your taxes and the cost of doing business (bills, salaries, etc.) from your net revenue.
Net income is a bottom-line metric. And it may seem to be more beneficial to go through with the net income, as opposed to net revenue, but this isn’t exactly true, as net revenue will help you keep track of how much money you need to earn in order to keep as much as you need in your pockets.
What is a good Net Revenue?
Well, what kind of question is that? You know the answer!
9. Net Promoter Score (NPS)
What is Net Promoter Score?
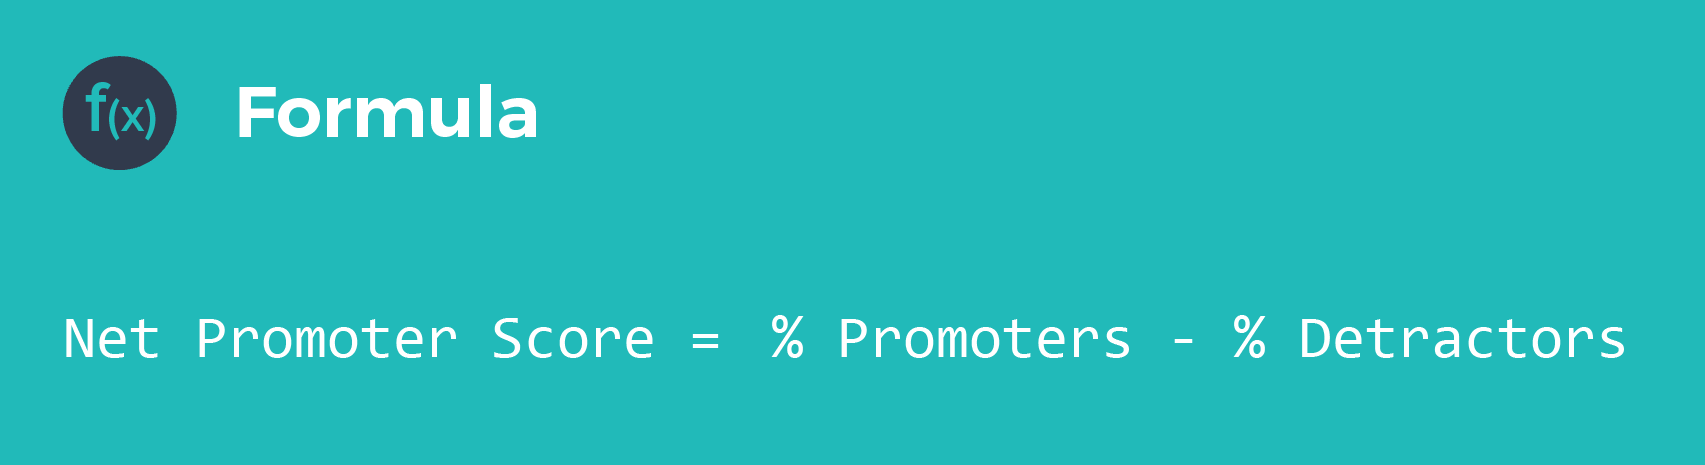
Closely connected to your business’s revenue growth, your net promoter score is the extent to which your customers are loyal enough and would recommend your business.
More specifically:
On a scale of 1 to 10, how would your customers rate your company?
Your nines and tens are your promoters, naturally.
Your sevens and eights are your passives-they’ll still buy, but it’s not like you’re the only business out there for them. And then, you’ve got your zeros, all the way up to your sixes. They are your detractors, ie the customers that can actively damage your company.
If you want to calculate your NPS, just subtract the percentage of detractors from the percentage of promoters. Your NPS can range anywhere from -100 to +100.
What is a good net promoter score?
If your NPS score is higher than zero, it is considered a good score. However, if you score on the negative scale of this continuum, it’s not necessarily bad.
You need to check the average in your industry, in order to be able to judge, but more importantly, you should keep track of the improvement-or lack, thereof-in your previous NPS over time.
10. Product Views
What is Product Views?
Product Views is a metric that corresponds to a trigger on Automation regarding how many times a specific or random product has been viewed.
More specifically:
When setting up automation under this trigger “Those who have viewed any product” and you see that it gets triggered an awful lot of times, chances are there is something extremely valuable for your business there.
So, by checking to see your most viewed products, you can see what your customers want more of.
The same applies to Page Views and Any Link Clicked.
What is a good Product Views rate?
Guess! The higher the better!
Marketing Metrics for Email Marketing Professionals

Email Opt-In Conversion Rate | Number of subscribers | Email Open Rate | Click-through Rate (CTR) | Click to Open Rate (CTOR) | Unique Links Clicked | Total Links Clicked | Total Email Unsubscribe Rate | Total Email Forwards | Bounce Rate | Not Opened | Marked as Spam | Revenue Per Campaign | Revenue Per Subscriber | Revenue Per Email Opened |
11.Email Opt-In Conversion Rate
What is Email Opt-In Conversion Rate?
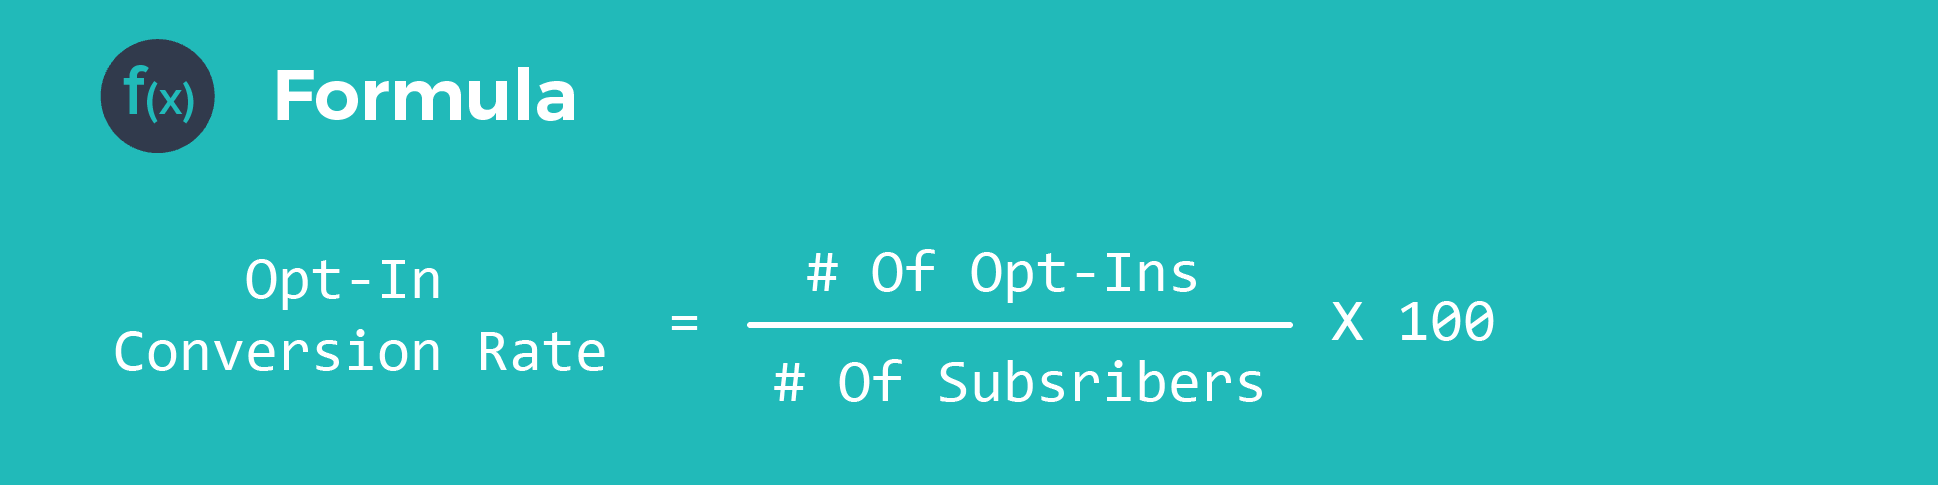
The opt-in rate for email marketing refers to the number of people who end up in your subscribers’ list.
More Specifically:
Let’s assume that 1000 people visit your website daily and you get 27 signups every day. This would mean that your Email opt-in rate is 2,7%. And that 2,7% has a chance to see something in your newsletters and, ultimately, convert.
So, the aim to increase that rate with a killer offer, better copy, more enticing CTAs and a design that would be to-die-for! The higher the rate, the better for you, the higher the chances to sell.
What is a good Email Opt-In rate?
As I’ve already mentioned, marketing metrics are industry-specific more or less. But keep in mind that you’ll be okay with anything between 2-5%. Anything lower than 1% will need improvement, but you don’t need to be a marketer to think of that.
12.Number of subscribers/List Growth
What is the Number of Subscribers?
The number of subscribers refers to the number of people who have signed up to your mailing list.
More Specifically:
You might think this is one of the marketing metrics you should always keep your eyes on.
Although you need to keep in mind that all lists decay and that it is absolutely natural that you lose as much as 2% of your mailing list every month or 22.3% every year.
This means that you could be churning subscribers at a similar rate.
Your number of subscribers is also bound by other factors, such as your opt-in conversion rate.
Another factor that could play a role in the number of your subscribers could be whether you use single or double opt-in.
The former subscription method brings in many more leads, but not higher quality ones, necessarily.
What is a good Number of Subscribers?
Well, since there are 3.9 billion email accounts all over the world, I’d say a good rate would be around… Half? All of them? Your call, really!
13.Email Open Rate

What is an open rate?
Email open rate corresponds to the sum of your subscribers that opened your email campaign.
More Specifically:
To calculate your email open rate you should divide your total number of subscribers with the number of those who opened the email, minus your bounced emails.
What is a good open rate?
It all depends on the size of your list, the industry you are in, the frequency you send newsletters with, whether you are sending to a segmented list and so on.
All things considered, a good open rate is anything approaching a quarter of your mailing list, that is 25%.
To be exact, that would be a fantastic open rate; it would mean that one out of four subscribers opens your email.
What’s open rate good for?
An open rate is indicative of the top-of-funnel, so to speak, performance of your email newsletter.
It is also indicative of your subscribers’ brand loyalty.
In other words, a low open rate could mean a weak subject line, or a sender name that could perform better, a send time that does not make sense
14.Click-through Rate (CTR)
What is CTR?
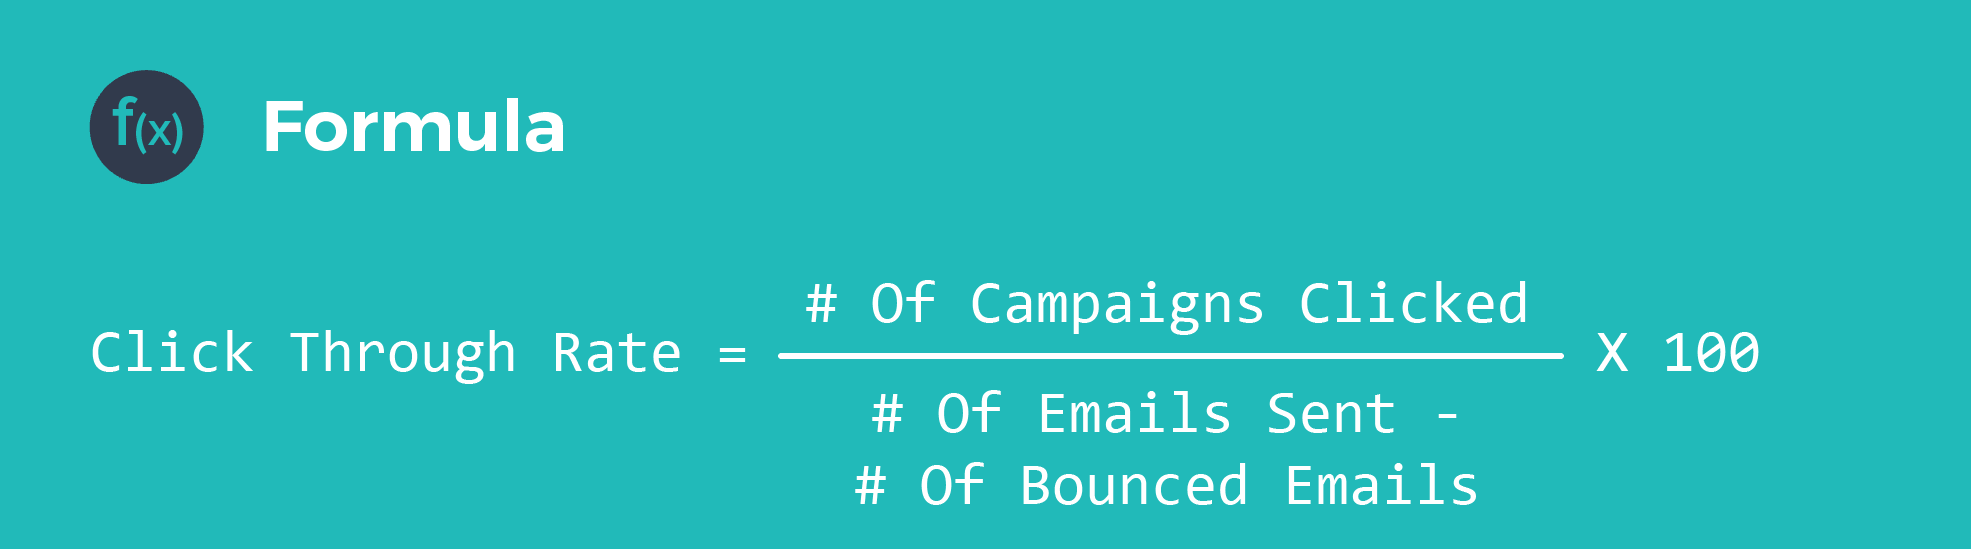
Click-through rate is the number of subscribers who opened your email campaign and clicked on any link in your email body.
More Specifically:
To calculate your CTR divide unique links clicked by emails sent, and multiply by 100.
What is a good CTR?
A good CTR stands at approximately 5%, according to IBM’s 2016 Email Marketing Metrics Benchmark Study.
Of course, other factors may influence a CTR such as your industry or your sender reputation.

15. Click to Open Rate (CTOR)
What is CTOR?
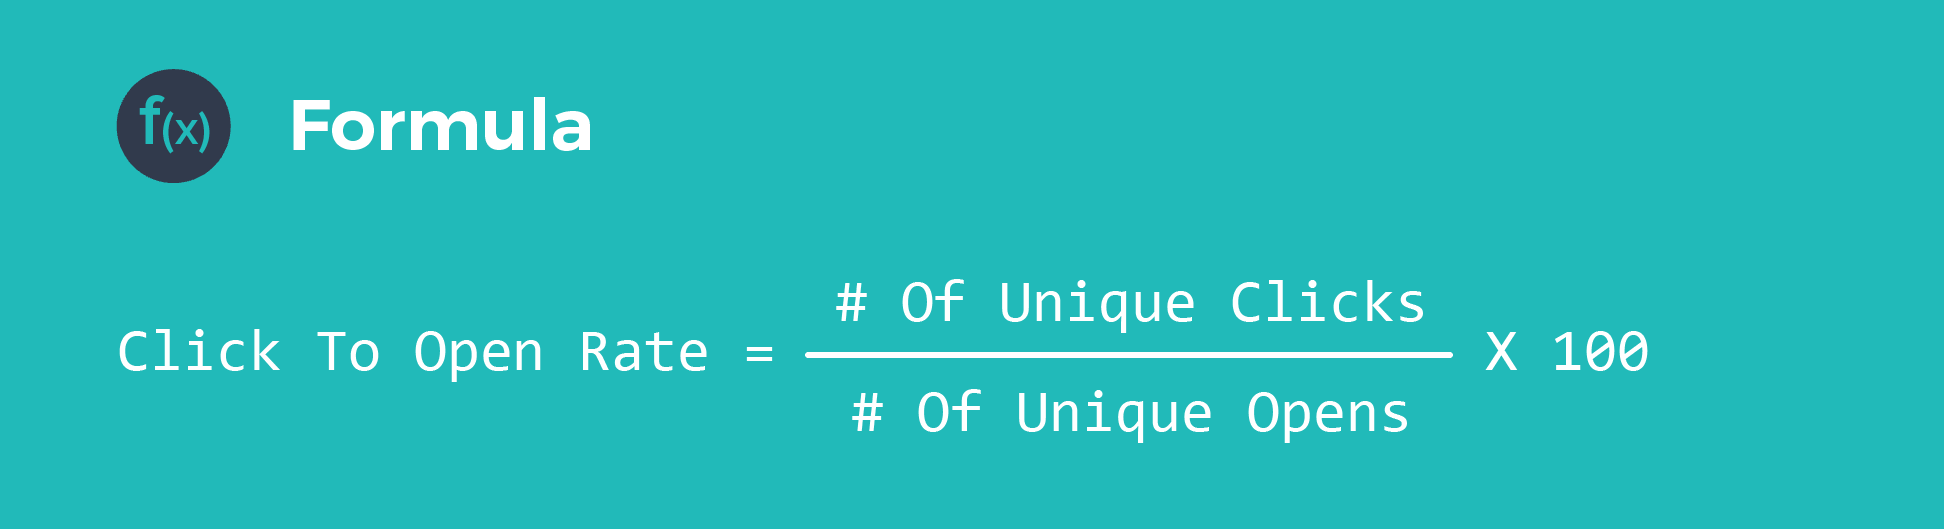
Your Click To Open Rate shows you the number of clicks taken from the email body of your newsletter alone.
More Specifically:
If the open rate is the marketing metric that measures the performance of our subject lines, CTOR is the measure of the effectiveness of our content. You can calculate it by dividing the number of unique clicks by the number of unique opens.
So, if you sent out 200 emails and scored 100 unique clicks, then your CTOR is 50%.
You should keep in mind that click-through rates (CTR) give us a representation of all clicks from as soon as the email hit the inbox, as opposed to click to open rates (CTOR), which account for the number of clicks occurring after an email has been opened. As you understand, if you are looking to include opened emails in your equation, you need CTOR.
What is a good CTOR?
It will vary, but let’s say that a good CTOR can be anywhere from 20% to 30%.
16. Unique Links Clicked
What is “Unique Links Clicked”?
This metric will indicate how many subscribers clicked on your link(s).
More specifically:
Let’s say you send a campaign with one link to 100 people and 70 of these subscribers click your link.
This number indicates the unique links clicked, seeing as it’s the first click one subscriber makes to one of your links.
What is a good Unique Links Clicked rate?
Ideally? 100%. Again, industry standards play a huge part.
17.Total Links Clicked
What is “Total Links Clicked”?
The total links clicked is the total of the times one subscriber clicked on one of your links.
More specifically:
Again, let’s look at that campaign we mentioned before. Now, under total links clicked, you find 140. Well, it seems that some of your subscribers clicked more than just once.
So, suppose your newsletter was promoting an offer or a hot deal to be claimed within the following few hours.
Those who went back to check the item or its availability through your email link, accounted for more links clicked.
What is a good Total Links Clicked rate?
As many as possible!
18.Total Email Unsubscribe Rate

What is Total Email Unsubscribe Rate?
The Total Email Unsubscribe Rate is the percentage of the recipients that have clicked on the unsubscribe link.
More specifically:
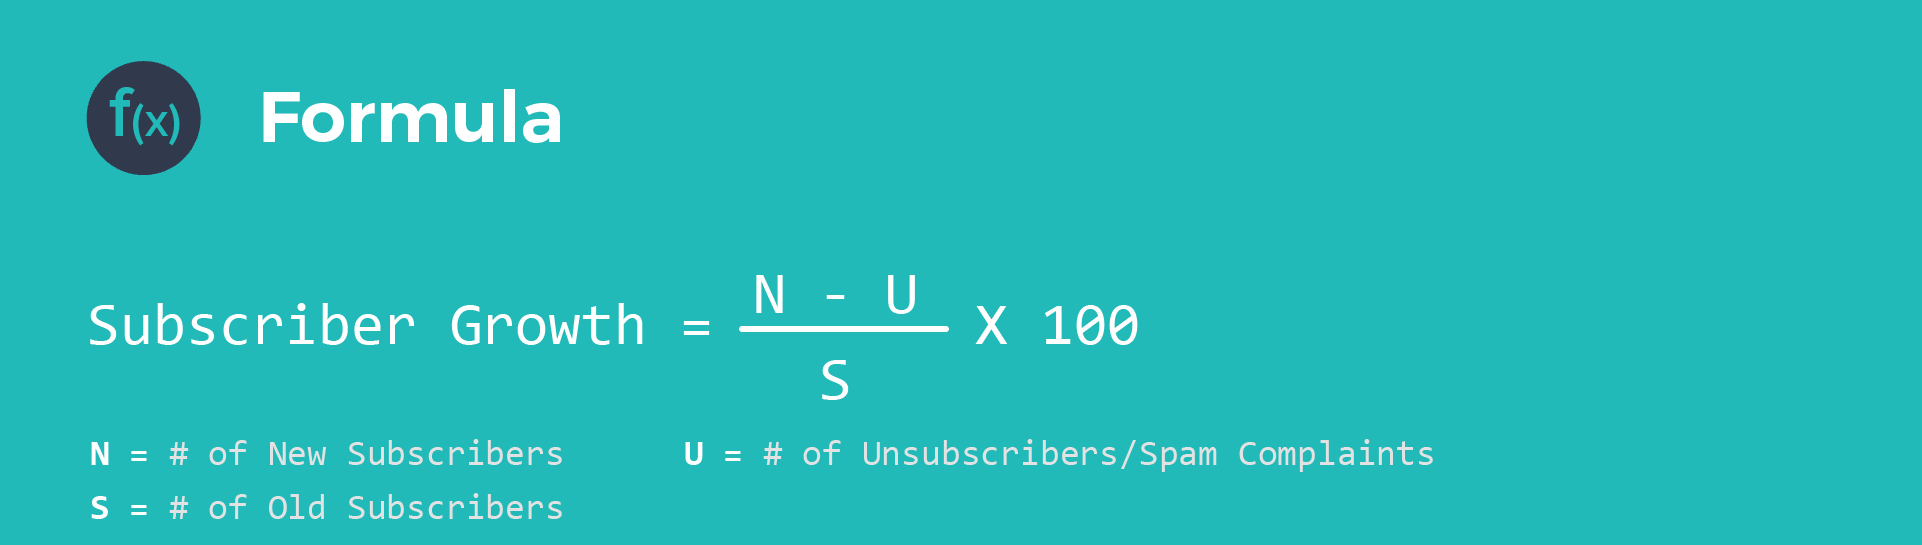
In order to find that rate, you need to divide the total number of unsubscribers by the total number of emails delivered and then, calculate the result by 100.
You need to ensure that your unsubscribe rate remains much lower compared to your list growth rate. Oh, and for the record, your list growth rate is the number of new subscribers minus unsubscribes and email complaints divided by your total list size.
What is a good Total Email Unsubscribe Rate?
Aim for something less than 1%. Anything above that means that your email marketing tactics need a lot of work.
19.Total Email Forwards
What is Total Email Forwards?
Total forwards is a metric that keeps track of these “referral” type emails.
More specifically:
How many times were your subscribers so absolutely blown away by your phenomenal newsletter that they shared it with a friend? Total forwards is that cute little button in your newsletter which leads to a new landing page altogether. Therefore, it does not correspond to subscribers clicking “Forward To” on their Gmail or Yahoo clients.
Here is an example:
The “Refer a friend” button frequents newsletters like so:
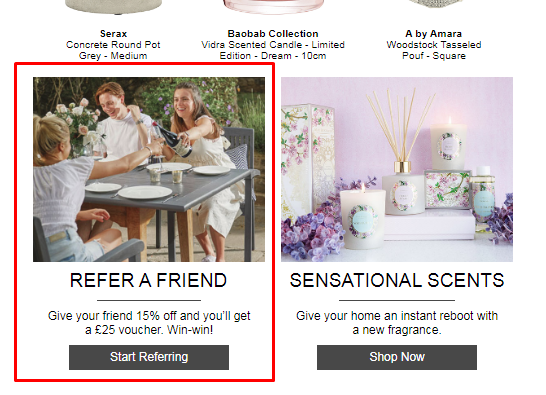
…but you can also receive a dedicated newsletter entitled “Don’t forget you can earn £25 for introducing a friend!” like so:
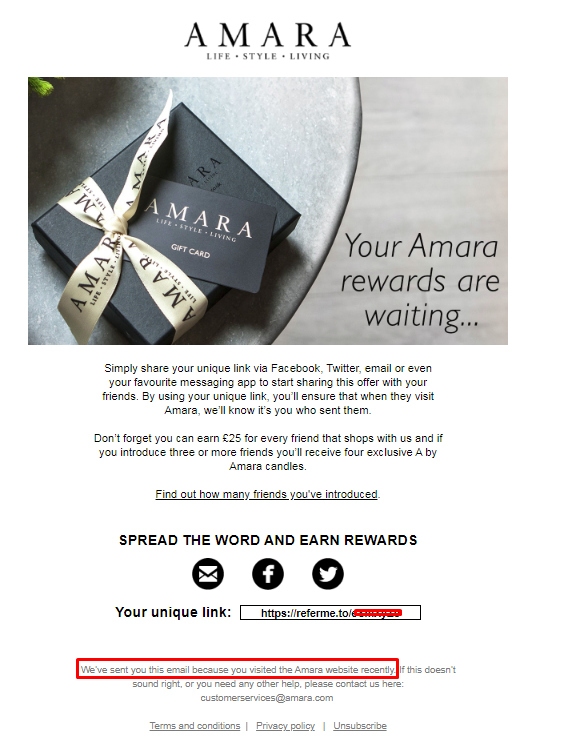
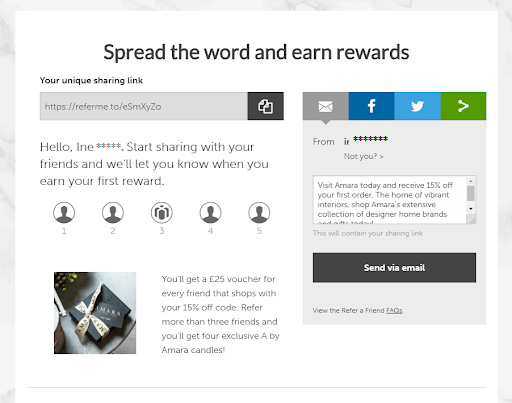
Once you click either link you are redirected to this page:

Upon entering your full name and email address (and choose how your details appear to your recipients), you get your own sharing link:
Does this remind you of Affiliate Marketing? It certainly resembles it.
What is a good Total of Email Forwards?
Well, let me put it this way: What is a good number of referrals? The answer would be “A big number”!
20.Bounce Rate
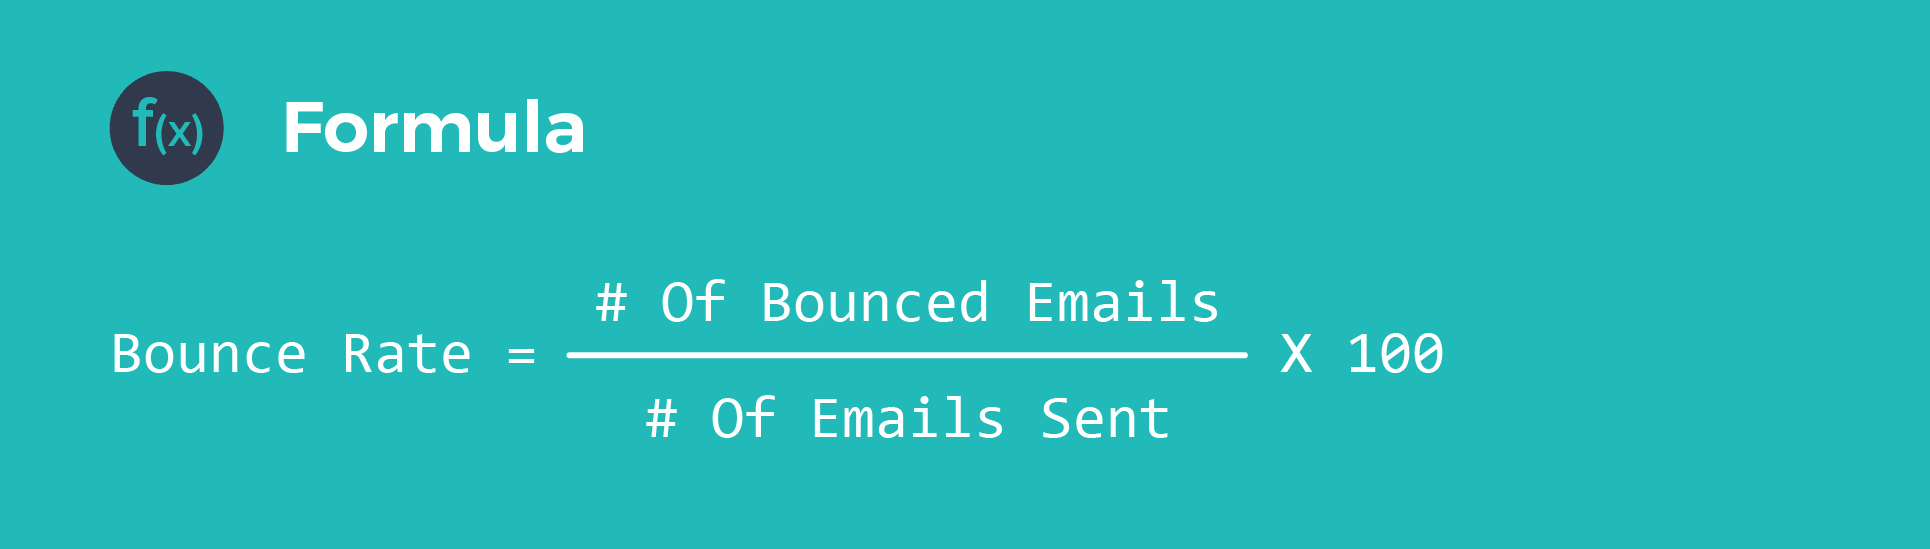
What is a Bounce Rate?
In email marketing, this rate is the percentage of email addresses from which your email bounced back-ie was sent back to you.
More specifically:
In order to calculate that rate, you need to divide the number of emails bounced by the total number of emails sent and multiply by one hundred. But there is more to it than just calculation, as we can categorize bounces to hard and soft bounces. Here’s how:
Hard Bounces vs Soft Bounces
What are Soft Bounces?
Soft bounces are the emails that were sent, duly processed by email clients (Gmail, Yahoo, etc.) but they never made it to the subscriber’s inbox.
What may have happened is that the subscriber’s inbox was full, or the server was down, or your message was too large for the recipient’s inbox.
This sounds like that email address was “just not that into you” (this is a reference for the few).
Before you move on with your life and find the next one (yes, we are still talking about email addresses), give them a second chance before you remove them from your list.
And a third one. But no more than four, my dear.
After having bounced softly for 4 times, they are then marked as Soft bounces and they are removed from your mailing list (but can still see them).
What are Hard Bounces?
A hard bounce is a no-can-do moment in email marketing.
Your message was never delivered; it was either a wrong address or the recipient was unknown.
On Moosend, bounced addresses are automatically removed from your list so that your lists remain clean and the ecosystem remains a safe place to send emails in.
We love you, too.
What is a good Bounce Rate?
You need this number to be small, very small. In general, anything between 25-40% is acceptable. Anything above that range could damage your reputation and, ultimately, your deliverability.
21.Not Opened
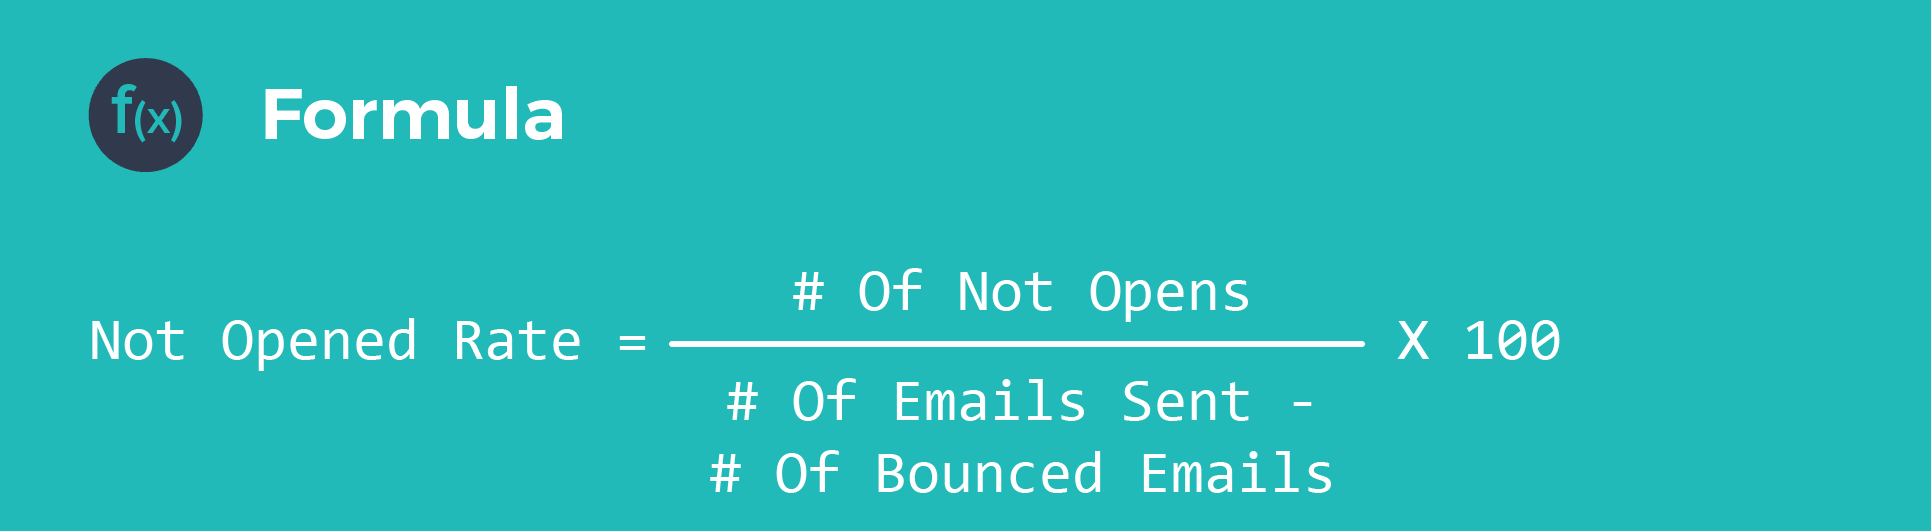
What is the Not Opened rate for emails?
It’s the number of emails that have not been opened by your subscribers.
More specifically:
Oops! Some people couldn’t handle the awesomeness that day and they didn’t open your email.
But it’s okay, some companies such as Moosend (heh) have tools in place so that you can automatically and preemptively have a “resend to unopened” campaign scheduled for a future date.
The bonus? You can change the subject line so that it doesn’t show and get a second shot at earning that open!
Just subtract the number of opened emails from the total of your delivered emails and then hold onto that number and divide it by the total of emails delivered. Multiply that by 100 to get the exact percentage.
For example, let’s say that you’ve sent 1000 emails. Out of those, only 500 were delivered and only 250 were opened. The remaining 250 are your unopened emails. So, you’ve got 250/500=0.5. And then 0.5*100, which will give you a 50% rate of not opened emails.
What is a good Not Opened emails rate?
Not to sound repetitive, but you should keep that as low as humanly possible.
22.Marked as Spam/Complaint Rate

What is Marked as Spam?
When someone receives your email and labels it as “spam”.
More specifically:
Marked as spam is also known as an abuse complaint and it’s what happens when a subscriber reports your newsletter as spam. Strange as it may sound, some subscribers will complain and will actually do this.
There is a number of reasons behind that, so don’t feel attacked; maybe they just don’t know how to unsubscribe. Or you hid that unsubscribe button, so you well deserved what was coming, seeing as it’s the “easy” way for a subscriber to be instantly removed from your list.
Many spam complaints can result in low deliverability rates and harm your reputation by a lot.
What is a good Marked as Spam rate?
Low. Very low. 0% low.
23.Revenue Per Campaign

What is Revenue Per Campaign?
The Revenue per campaign (aka Revenue per email sent or Revenue Per 1000- RPM) corresponds to the revenue that can be attributed to the total number of emails sent.
More specifically:
Use the Revenue Per Campaign metric to compare the sales performance of your campaigns. Then, analyze the most successful campaigns to extract the components of success to your own pool of successful elements.
And don’t forget to test away, since every campaign is-and should be-different and segmented.
What is a good Revenue Per Campaign?
Ideally, you need every single email to convert, but it still depends on what that email is and what your goals are.
24.Revenue Per Subscriber

What is Revenue Per Subscriber?
It’s exactly what the name indicates: the revenue generated by each of the subscribers in your mailing list.
More specifically:
By keeping tabs on your subscribers’ revenue, it is easier for you to filter out those who account for 50% of your revenue. Just divide the total revenue of your business by its total number of subscribers.
Spot the most valuable subscribers for your business, and craft campaigns that resonate with your audience.
Last, use top revenue-generating subscribers to inform your marketing decisions and loyalty program rewards, accordingly.
It’s best if you do this on a monthly basis.
What is a good Revenue Per Subscriber?
Again, depends on your niche’s standards.
25. Revenue Per Email Opened
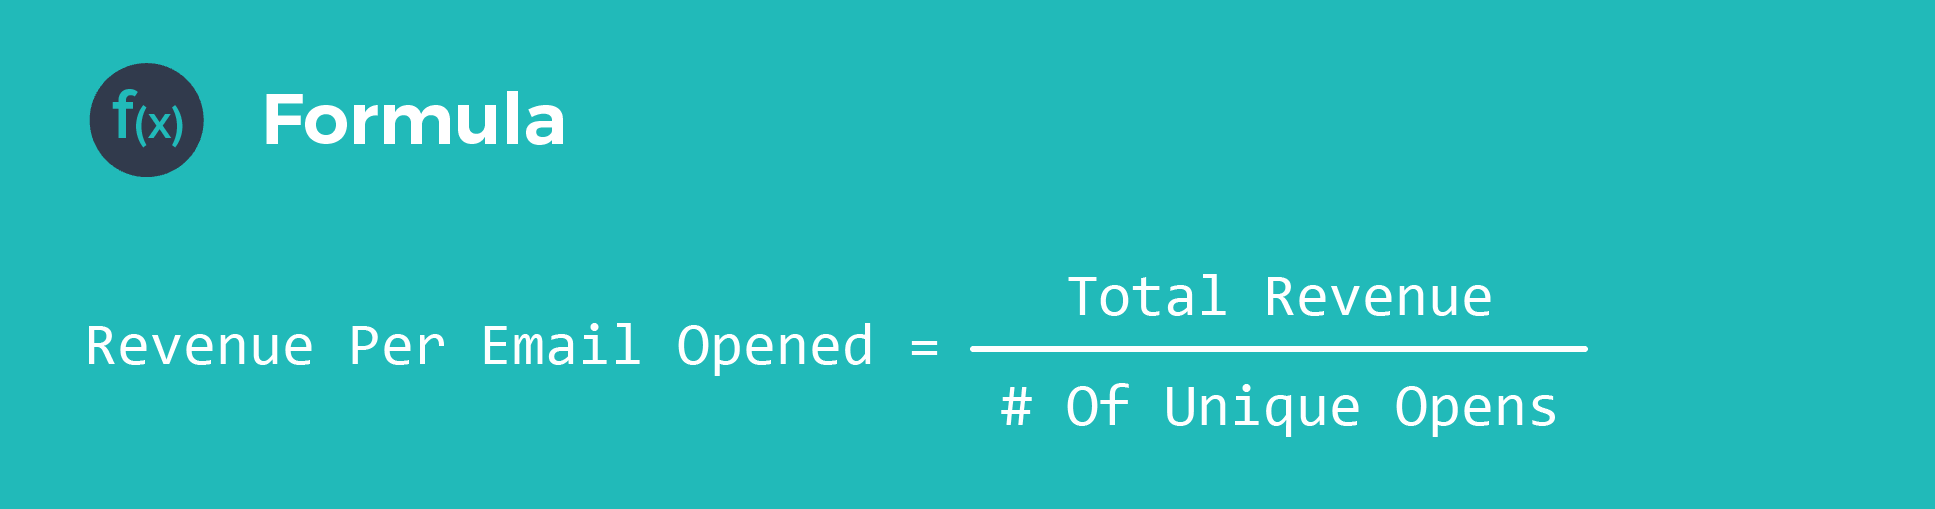
What is Revenue Per Email Opened?
It’s the revenue that was generated by your opened emails.
More specifically:
The revenue per email opened is the amount of revenue generated, divided by the overall clicks of your email.
How awesome to know that every single newsletter you send has the same potential: to earn you so much money. I know right? You never have to wonder how much money is made every time one of your links is clicked!
What does your Revenue per open look like? What can you do to increase it? Well, here’s your answer: To increase this metric you need to increase your numerator, that is your Revenue.
This can be achieved by setting up Automated Recipes, such as Upselling, Cross-selling, Special Offers, etc.
What is a good Revenue Per Email Opened?
As much as humanly possible. Get those CTAs going and check for yourself!
Email Marketing ROI
Everyone knows that email marketing has an average ROI of 1:40. That is, for every dollar you spend towards Email Marketing actions, you get 40 dollars back.
Time to see how your business performs against this:
Having estimated your revenue per email sent, you can calculate your earnings less email costs, by multiplying revenue/email sent with the average margin per sale on your eshop.
Then, to estimate your total ROI from email marketing, all you have to do is divide your earnings fewer costs by your email costs, like so:
If you are on Moosend, your ROI will be much higher. With such low prices, it makes sense to do everything there is on email marketing and automation (at no extra charge, hey).
Marketing Metrics about Social Media

Facebook | Instagram | Youtube |
Social media marketing comes with its own set of metrics.
Some of these are commonly shared by all social media networks, others are specific to one network or are only tracked and shared with content creators/marketers in some cases.
We’ll go over the essential metrics for your marketing:
One thing we need to specify about Facebook metrics is that some of them are sampled and others are estimated.
Data sampling refers to analyzing a sample of the data instead of a set of data. It is representative and generalizable for large amounts of data to analyze with high accuracy.
Estimated data is used to help quantify insights or outcomes which are hard to track otherwise. This can improve as we go along. For the full list of estimated metrics, click here.
26. Facebook Reach
What is Facebook Reach?
According to Facebook, Reach refers to the number of unique times your ad has been viewed.
More specifically:
Facebook reach is different from Impressions. But how? Impressions is a much larger number which comprises the total number of views, including repeat views per person per ad.
What do you use Reach for? To see how many people saw your ad.
Even if they didn’t engage with it, your ad may have raised awareness or might encourage brand recall in the future as soon as your audience is exposed to your ad again.
What is a good Facebook Reach?
Bid, budget or audience targeting may influence your reach. Your reach is good if you’ve gotten your money’s worth in terms of reach, engagement, and targeting (high-quality leads).
27. Impressions
What are Impressions?
Simply put, impressions account for the total number of times your ads were seen by your target audience.
More specifically:
As specified by Facebook, if a user saw your ad and scrolled past it, this counts as 1 impression. If they decide to scroll back up, this still counts as a total of 1 impression.
However, if the user is shown the same ad for a second time at a different time, day or because someone shared it, this counts as 2 impressions. Keep in mind that clicking on it doesn’t count-this metric merely shows how many times your content was shown.
To find out more about impressions, video impressions, etc., click here.
What is a good Impressions rate?
The more impressions, the better the chances of converting.
28. Frequency

What is Frequency?
Frequency is the average number of times a person in your target audience has seen your ad.
More specifically:
In order to get the number right, you’ll need to divide the total of impressions by the total of reach.
Now, you may get an average of 2 for each ad. This means that some of the people that have viewed your ad may have scrolled past it and some others may have seen it more than two times. The number could be a result of targeting or the budget you have set for that ad campaign.
To build brand awareness and brand recall you should run the same or similar ads to the same audience in order to encourage association between the two sides.
What is a good frequency rate?
The best rate is between 1 and 2 exposures, according to Facebook’s standards.
29. Relevance Score
What is the Relevance Score?
The notorious relevance score by Facebook is a score assigned on a scale of 1 to 10 and refers to how your audience responds to your ad.
More specifically:
As soon as you read 500 impressions, you can see what your relevance score ranks for. If you score a relevance score of 9 out of 10 then you can rest assured that your ad (copy and image) is right on track!
So, soon as you spot an ad that is performing well you can increase its budget. This way, you won’t have to spend a month’s budget on a single ad!
To arrive at a relevance score estimate, here is a list of things that Facebook takes into consideration:
- Positive feedback
As positive feedback, Facebook counts likes, clicks, or app installs.
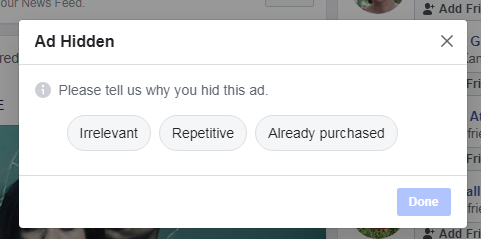
- Negative feedback
If users click “I don’t want to see this” on your ad, it sort of informs Facebook that either your targeting was irrelevant, intense (spammy), or even that your ad was offensive.
What is a good Relevance Score?
You need a high relevance score (higher than 5), to outperform your competitors without being outspent by them.
30. Cost Per Result
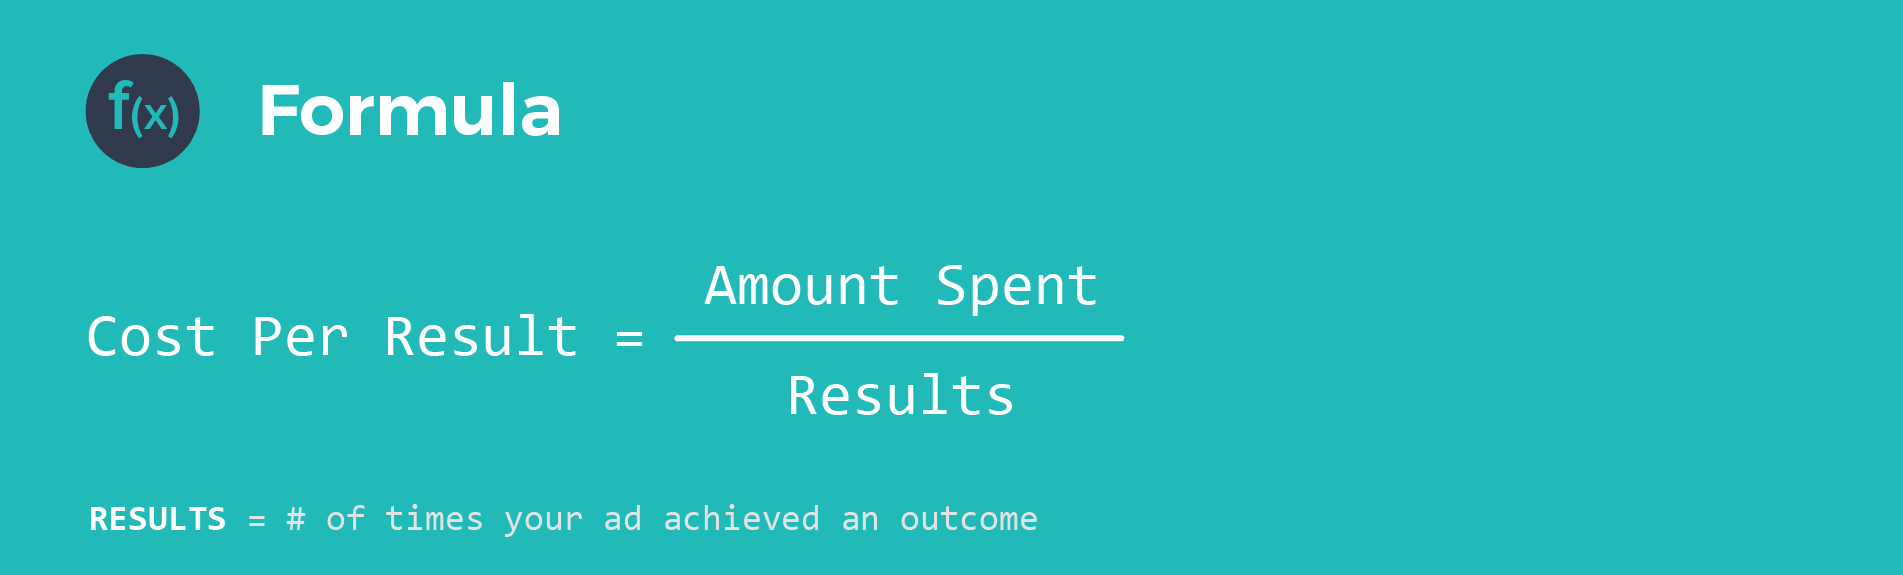
What is Cost Per Result?
This one refers to the cost for every result your ads bring.
More specifically:
To calculate it, just divide the total amount spent by the number of results.
Wondering whether your target audience is worth pursuing further?
By comparing cost per result for different campaigns (or even the same campaign) you can make adjustments to optimize each ad’s performance.
For example, if a given targeting strategy for your ad campaign requires 25 cents per result, then consider a change. This way, if you change the copy of the ad or the visuals you are using you might achieve a lower cost per result.
Keep in mind that not all results cost the same. Having said that, liking a page costs higher than liking a post. Also, the pricing of that result depends on the industry and competition or other ongoing promotions at the time.
To overcome that, consider switching your least performing ads off for a while and taking them out for a spin again later that month.
What is a good Cost Per Result?
There is no golden rule for that one, except for the fact that the amount spent should be low, compared to the number of results.
31. Instagram Reach
What is Instagram Reach?
Instagram Reach is the total number of people (unique accounts) your post or story reached.
More specifically:
This number is always much lower compared to Impressions. Wanna know why? Well, just keep reading!
You need to know your Instagram reach, in order to estimate the user engagement per post. In order to do that, just multiply likes by 100 and divide by reach. For example: Let’s say that your photo reached 300 people and you got 30 likes. This means that you harnessed a 10% engagement.
That’s pretty good, generally.
Here’s a tip: As your following increases, you shouldn’t expect your organic user engagement to remain as high as 10%.
What is a good Reach for Instagram?
Try to post original and catchy content, as you’ll need that number to be high.
32. Instagram Impressions
What is Instagram Impressions?
That number shows how many times (and not people) your content was shown, whether it was a post or a story.
More specifically:
You’ll notice in your dashboard on Instagram that impressions are the highest number. This essentially means that a number of unique accounts have viewed your post or story multiple times.
So where do these come from?
Well, the crazy thing about Impressions on Instagram is that you see the number of impressions that came from Home, Hashtags, Profile, or Another source.
If you see that one of these worked particularly well for you(r post), you know what to do.
What is a good Impressions rate for Instagram?
“As many as possible” is the only answer that matters!
33. Profile Visits
What is “Profile Visits”?
This metric indicates the number of people that visited your Instagram account.
More specifically:
How many users visited your profile after they came across your content? This number is important for you to check because it is indicative of the number of followers that are eager to not only view your content but take the time to look up your account and actually see it for themselves.
This number is available to business accounts only and was launched a year ago.
Now, what can someone do when they’re in your profile? Well, stalk you, of course! But this is not what that article is about.
One thing they can do, for example, is to click on the links you’ve included in your bio or posts. This counts as a website click and can generate anything you’d like it to generate, from subscribers to buyers to anything you can imagine.
If you’ve included your email address in your bio and people sent you an email as well, then your content is super nice and to the point, or you’re very lucky!
What is a good number for Profile Visits?
As high as possible. And make sure that your content can boost your engagement rates, while we’re at it!
34. Story Replies
What is Story Replies?
It’s the number of replies your story got-ie the engagement rate of your story!
More specifically:
How many replies did your latest story garner? And what about the one before that? Keep tabs, it’ll help you in the long run! If your followers are loving a certain type of story then maybe you could scale things up, test, experiment and serve content that’s good enough to eat (see what I did there?)!
This is a great way to poll your followers without actually saying the words. Not to mention what it can do for your relationship with Instagram’s algorithm.
The great thing about these metrics is that you can access this information even weeks later, so you could have your own monthly top posts classification.
What is a good Story Replies rate?
Well, on average, a brand will get a reply from 1,6 user/s out of 10,000.
YouTube
35. Watch time
What is Youtube’s Watch Time?
Watch time is the total amount of minutes your viewers watched your content (videos, ads, anything) for.
More specifically:
If you take the views of your channel and multiply them by the average view duration, the number you’ll get is the watch time.
This metric is quite important, according to YouTube – so much so, that it has replaced Views in the analytics tab. And it’s only logical, since YouTube is the new television, especially when it comes to younger audiences.
Keep in mind that YouTube requires that certain criteria are met in order for creators to be able to monetize their views. In other words, you cannot earn money from YouTube as a creator unless you have 1,000 subscribers and 4,000 hours of watch time within the past year.
But there are some other factors that play a part when it comes to your Watch Time:
- Start of Session – ie how many people start viewing one of your videos
- Session Duration – ie the number of minutes someone spends on YouTube in general and how this affects your own videos
- End of Session – ie how many watch sessions ended with one of your videos
- Upload Frequency – I don’t think this one needs an explanation
What is a good Watch Time?
In general? People don’t watch videos that are longer than 5 minutes. But again, this is not a set-in-stone rule.
36. Audience Retention
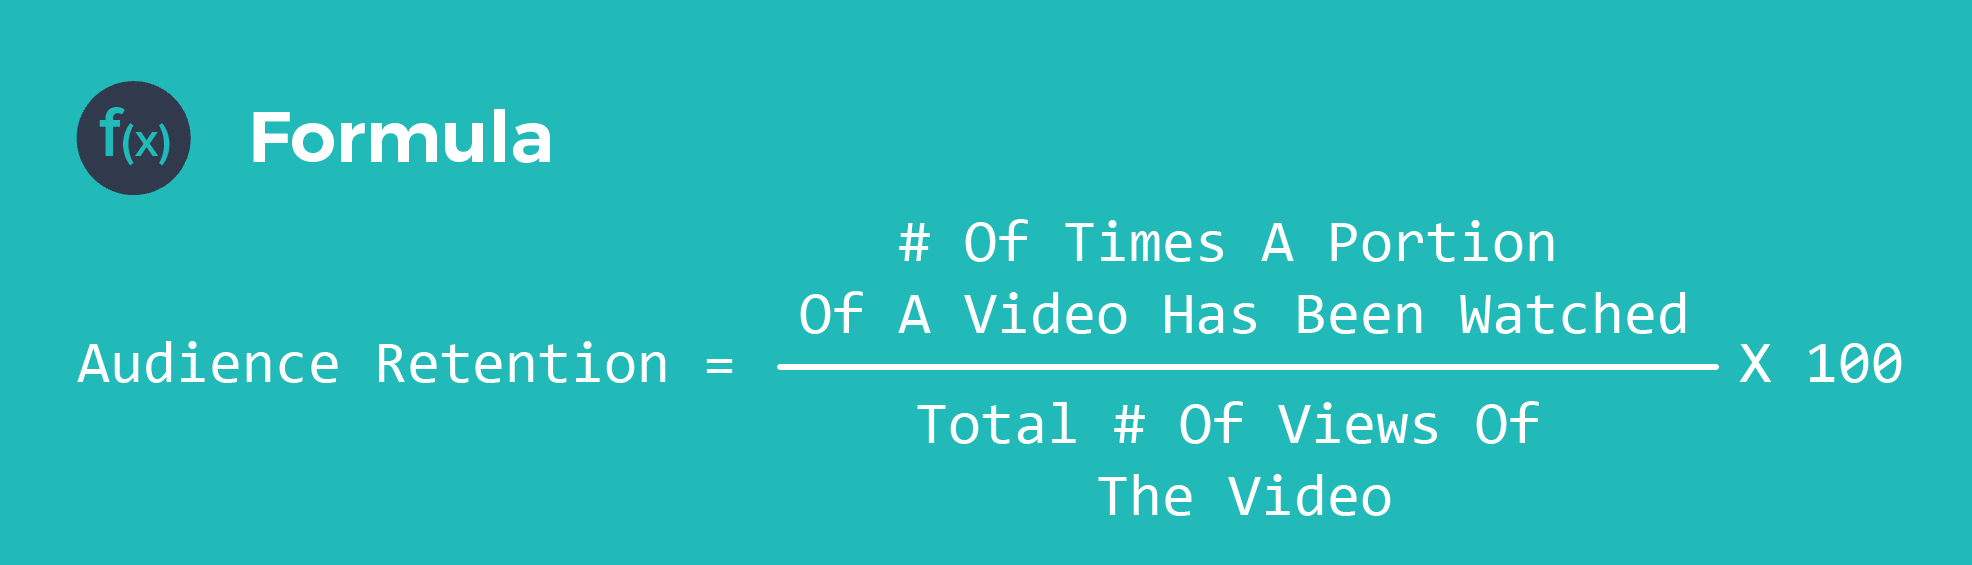
What is Audience Retention?
Audience retention is the amount of your video the viewers have watched.
More specifically:
Let’s say that you open a 12-minute video and that you watch the first six minutes, therefore, 50% of the video. This percentage shows the audience retention rate.
It is important to have that metric under control, seeing as YouTube keeps track of the videos with a high retention rate. In fact, it prefers these videos, as it seems that they’re informative, targeted and answer the viewers’ questions.
And YouTube loves viewers. This means that its algorithm will help this video rank higher on YouTube’s search results and Suggested locations.
What is a good Audience Retention rate?
Anything above 60% is above average and above-average is the average you need!
37. Average view duration

What is the average view duration?
This metric is the number you’ll get if you divide the total watch time of your video by the total number of video plays.
More specifically:
The total number of video plays includes the replays as well. Of course, it doesn’t take an expert to know that content plays a major part when it comes to that number, as what it essentially does is measure how engaging the video is.
A non-engaging video will have viewers close the tab pretty quickly-you don’t want that, as it will lead to low rankings, both when it comes to search and when it comes to YouTube recommendations.
What is a good average view duration rate?
There is a general 50% rule for that one, as viewer retention is very common at the 50-60% mark. Anything above that is a very good rate.
Just make sure to include the links and products you’d like to include (if any) in the first half of your video, in order for them to reach more viewers.
38. Views
What is “views”?
The views your video has indicate the number of people that have watched it for more than 30 seconds.
More specifically:
The views of a video are what determines its success and you can track it by checking your views monthly.
Keep an eye on the graphs YouTube provides and make sure you take these parameters into account: the frequency of your videos and the amount of views a video gets over a set period of time.
Decode the reasons why your video is getting the views it does.
By doing this, you’ll get valuable information on the way your viewers perceive your videos and what content keeps them engaged and eager to see more.
What is a good views amount?
Ideally, you’d want your views count to be equal to your subscribers count at least. But as with the aforementioned metrics, this depends on the type of your channel.
39. Impressions
What is “impressions”?
This number indicates the number of times the thumbnails of your videos appear on YouTube.This number indicates the number of times the thumbnails of your videos appear on YouTube.
More specifically:
Each impression is a potential viewer. It can be a very good indicator of how well you understand YouTube, the trending topics and the algorithm itself, and how well you optimize in order for your content to get more visibility.
However, there are some things you should keep in mind when it comes to impressions:
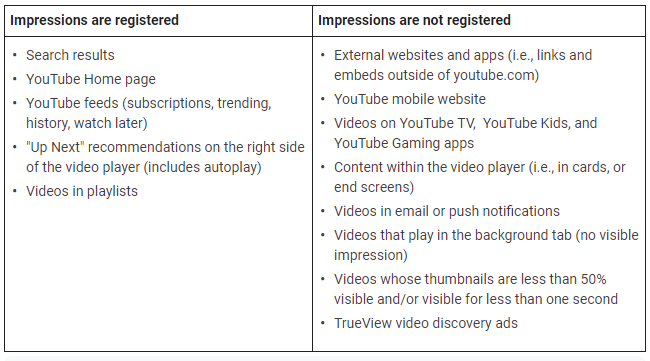
(Source)
What is a good Impressions rate?
Again, there is no standard here. It all depends on how well you understand the inner workings of YouTube. But if you have the impressions’ click-through rate in mind, keep reading!
40. View Through Rate (VTR)

What is View Through Rate?
The view-through rate (VTR) is what you’ll get if you divide the number of completed views on your video ad by the number of initial impressions.
More specifically:
VTR can measure how effective your video ad was. The higher the percentage of the VTR, the more impressions served resulted in users watching the ad.
This puts the impressions metric into perspective, as one would argue that impressions is a relatively insignificant metric.
Also, VTR is what puts engagement into perspective, as the data can be used to gain insight on what engages the viewers and how the ad campaigns can be improved and, ultimately, convert. Just keep in mind that you’ll need to hook them and use the brand in the first couple of seconds.
What is a good VTR rate?
If you manage to score something above 10%, you’re good to go, but again, it depends on your industry and your campaign.
41. Average Cost Per View (CPV)
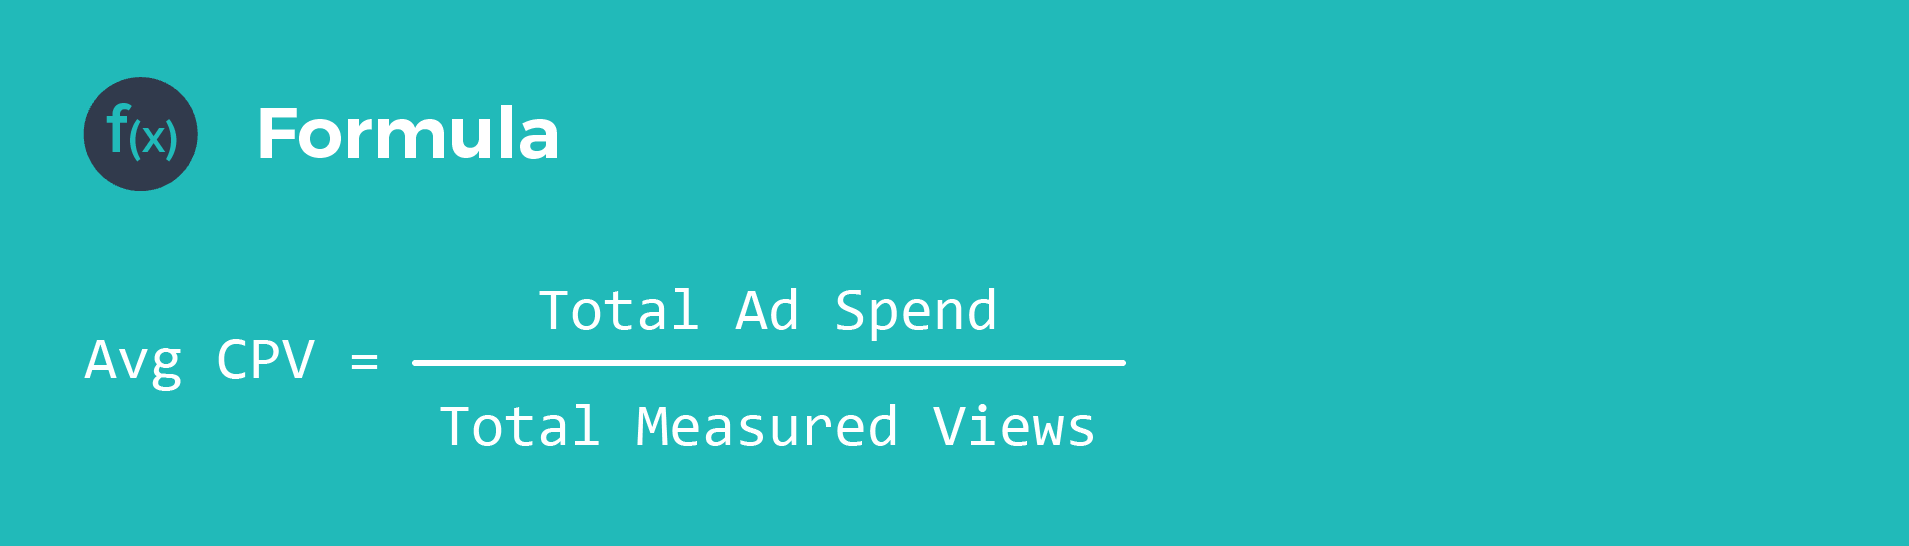
What is Average CPV?
The Average Cost Per View (CPV) is the amount of money an advertiser has to pay every time someone views their video ad.
More specifically:
The Average CPV can be measured if you divide the total cost of all views by the total amount of views. It is useful because it helps marketers calculate the average cost of each view.
Keep in mind that the CPV will vary. Some parameters to take into account would be your target group for the specific ad or the demographics.
What is a good Average CPV rate?
It depends on the goals you would like to achieve and the targeting of your campaign, but as a general rule, the lower the CPV the better, as it will mean that your ad reached more viewers.
42. Unique Viewers
What is the “Unique Viewers” metric?
This refers to the viewers that watch your video for the first time.
More specifically:
This metric uses your IP to determine whether you’re a unique or a repeated viewer. If one viewer watches more than one video, their views are shown in the “Views” tab, but you’ll only see the number 1 in the “Unique Viewers” tab.
It’s an interesting metric, as it can show you how engaging your content is for new viewers, but there is a small downside to that: Let’s assume that there is only one PC in a household and five members of one family. If all five viewed your content, it will still count as one viewer in the “Unique Viewers” tab. So, you may want to keep that in mind when extracting data.
What is a good “Unique Viewers” rate?
The bigger the better, as it generally means that your content has fewer repeaters and reaches a lot of new audiences, thus giving you a bigger chance to convert.
43. Impressions Click Through Rate (CTR)

What is Impressions Click-Through Rate?
Impressions Click Through Rate (CTR) is the metric that measures the percentage of your impressions that actually converted into views on YouTube.
More specifically:
When you upload a video, YouTube makes sure to promote it to various audiences. Impressions may increase, as you get more views. This means that they are shown to a wider audience that may not be interested in your content. So, there will be more views.
The CTR specifically, is the metric you’ll need to track in order to determine what you should keep and what you should change: Is your thumbnail good? What about the video’s title?
What is a good Impressions CTR?
Anything between 2 and 10% is average – top that and you’ll be good to go!
44. Card Click Through Rate (CTR)
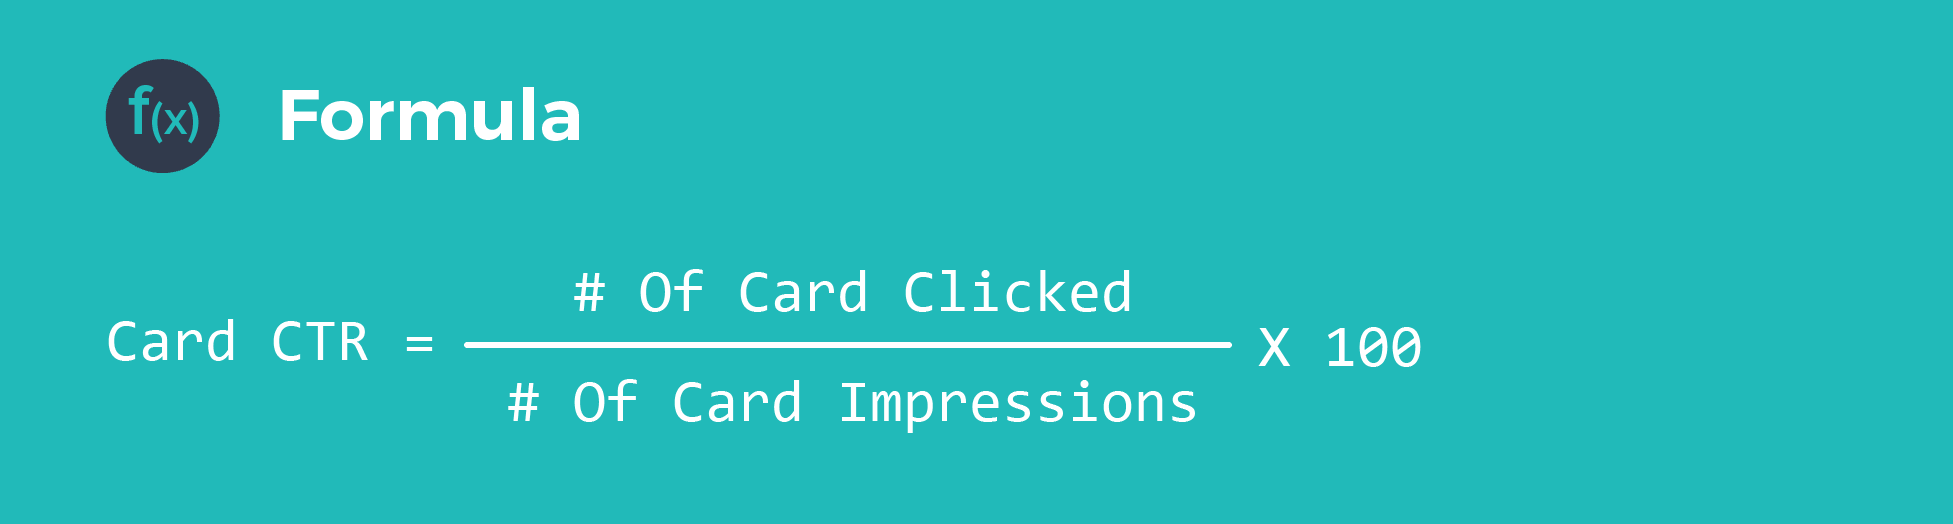
What is Card Click Through Rate?
Card Click Through Rate (CTR) is the number you’ll get if you divide the card clicks by card impressions.
More specifically:
Cards are slide-in panels that encourage people to take the desired action during a video like watch another video, subscribe to a channel, or click through to a different website. They appear at the side of a video.
You’ll need a very strong CTA for that one, but it can convert very well. However, you can’t use cards and CTA overlay, so if you’re a YouTuber, just encourage your viewers to interact, yourself. Also, make sure to let your viewers know that a card will appear, for maximum engagement!
Each of your cards’ click-through rate tells you which action your viewers prefer to take while watching your videos. This can help you place the most engaging card in each of your videos, potentially boosting your watch time, subscriber growth, or website traffic.
Analyzing card click-through rates can also help you uncover the optimal timing, placement, and duration of your cards in future videos. You can find your cards’ click-through rates in the Cards Report.
What is a good Card CTR?
The higher the better, as this will mean that your content will be fun and engaging – and worth a lot!
45. Playlist Engagement
What is Playlist Engagement?
You’ll get what your playlist’s engagement rate is if you analyze the following two metrics: Views per playlist start and average time in playlist.
More specifically:
Playlists in general, if used correctly, are a very powerful tool that can boost your YouTube engagement and, therefore, your channel’s views. They help viewers watch videos without being disrupted and without having to conduct multiple searches. So, it’s way more than a tool that helps organize your channel.
Be mindful of the views per playlist and the average time in playlist. The former metric is the average views your playlists can gather, whereas the latter is the average amount of time your audience spent viewing the videos on your playlist. The two, as we mentioned, give you your playlist’s engagement rate.
What is a good Playlist Engagement rate?
It may have become boring by now, but as with so many cases before, there is no specific number and it depends on your niche and what your goals are.
46. Unique Cookies
What is “Unique Cookies”?
Unique cookies is the amount of browser-specific cookies that were in one of your ads.
More specifically:
Unique cookies calculate reach, as you’ve probably already guessed. Which means, essentially, the number of people that have seen your ad in a period of time. As I mentioned above, unique cookies are browser-specific. So, in theory, one browser is one person.
In practice, things are a little more complex, as cookies can be deleted and people can view videos and ads without being logged in. Therefore, one unique cookie doesn’t equal one person, but the number is close enough to the actual users your ad has reached.
What is a good unique cookies rate?
The more people your video ad reaches, the better. However, there is no specific number for that one.
47. Average View Frequency

What is the average view frequency?
Average view frequency is the average number of times people have viewed your video ad.
More specifically:
The average view frequency measures the number of times your video ad has been viewed over a specific time period. Which means that, if that number is X on your analytics’ tab, it means that your video ad was viewed X times over Y months/weeks/any time period that you’ve decided to measure.
What is a good average view frequency rate?
Depends on your niche, however, there’s a small catch: People don’t watch ads more than once, because they don’t want to do so. So, you should expect this number to be closer to 1.
48. Average Impression Frequency

What is average impression frequency?
It is the average number of times your video ad was shown.
More specifically:
Average impression frequency is measured either per cookie or per user. In any case, it is used to report the number of times your video ad made an impression during the time period you’ve decided to measure.
Mobile IDs are also used to measure average impression frequency, as well as the country.
What is a good average impression frequency rate?
A higher average rate is better, as it means that your ad made an impression to a broader audience and was shown multiple times.
49. Subscriber Growth Rate

What is Subscriber Growth?
It’s the rate at which your subscribers increase.
More specifically:
Subscribers are your most loyal fans. They’ve made a public commitment to your brand, content, and values. And they’re most likely to be your evangelists, too.
Subscribers are also important to your channel because YouTube will send them notifications about your new videos and feature them on their homepage. This means they’ll see your videos more frequently, which help generate more views.
Subscribers also watch twice as much video than non-subscribers, so the more subscribers you have, the more watch time your videos will collect.
YouTube’s Subscribers Report will show you which videos, locations, and time periods gain and lose subscribers. This data will tell you what video topics resonate with your subscribers and where to target new subscribers. And by prioritizing your subscribers’ needs, you’ll create videos that they crave, increase your watch time, and boost your search rankings.
What is a good Subscribers Growth rate?
The more often you upload videos, the more subscribers you’ll get. Therefore, a good growth rate is directly correlated to upload frequency.
Marketing Metrics for SEO Professionals

Ahrefs Rank | Alexa Rank | Domain Rank | Referring Domains | URL rating | Backlinks | Organic Trafic | Keyword Search Volume | Organic Keywords |
50. Ahrefs Rank
What is Ahrefs Rank?
Ahrefs Rank (AR) is a list of all the websites in the Ahrefs database, ranked by their Domain Rating.
More specifically:
Of all the websites in all the servers in all the world… Well, Ahrefs took all these and made a list that ranked them according to the size and quality of their backlink profiles. It’s important for you if you want to understand how your market works in correlation to your website.
These numbers serve as indicators of how popular a given webpage is compared to others.
What is a good Ahrefs Rank?
Ahrefs ranks websites on a scale of 1 to… Well, infinity. But remember that an AR of 1 is the strongest.
51. Alexa Rank
What is Alexa Rank?
Alexa rank is a global ranking system that compares web pages in terms of popularity.
More specifically:
Alexa rank leverages website traffic data and ranks websites accordingly. This is a good way for you to analyze data and set goals.
We can’t be sure about the exact algorithm and how everything is calculated, but we do know that Alexa uses data that stem from a website’s traffic and user engagement over the previous trimester.
What is a good Alexa Rank?
The lower your Alexa rank is, the closer to the top you are.
52. Domain Rank
Domain rank is more or less a link analysis. After the “death” of Google’s PageRanks, other algorithms took over and started analyzing the backlink profile of the websites in their servers and ultimately, predicting how trustworthy, informative and useful Google would find them to be. Let’s take a look:
Moz Domain Authority
What is Moz Domain Authority?
Domain Authority is a metric developed by Moz, which shows the estimated ranking of a website on the SERPs.
More specifically:
Moz calculates DA in nefarious ways – ie they won’t reveal their secrets. What we do know is that its algorithm takes into account factors like linking root domains and how many total links a website has.
It’s a metric that predicts, therefore there is no correlation between that and Google’s rankings, in the sense that Google doesn’t use it.
What is a good Moz Domain Authority rank?
It ranges from 1 to 100, with 100 being the highest, as opposed to Ahrefs. So… You guessed it! The more, the better!
Ahrefs Domain Rating
What is the domain rating?
The domain rating is a metric developed by Ahrefs, that aims to show how strong a website’s backling profile is.
More specifically:
The domain rating shows how many pages link back to your content-ie how strong your backlink profile is. Its measure ranges from 1 to 100, which is the rating you should aim for.
The higher the DR, the better for the websites linked to it as well. A domain distributes its DR equally to the domains it links to. Which means that if you get a link from a low DR domain that links to fewer pages, it will have a bigger impact than what would happen if you got a link from a high DR domain that links to way more domains than the aforementioned one.
We don’t have a definitive formula that will help calculate this rating. However, domain rating is more than useful, as it can help you pick out which websites you definitely want a link from, as a high DR is of great value.
What is a good domain rating?
Fortunately, we’ve got an answer for you! A good domain rating would be anything above 50, with 50 being average. Score over 70, and your domain rating is excellent!
53. Referring domains
What is the referring domain?
A referring domain is the domain your backlinks are coming from.
More specifically:
Not to be confused with the backlink, a referring domain is a website where you get your backlinks from. Let’s assume that a blog post refers your website’s link 3 times. This post is on one single website. This means that you’ve got three backlinks and only one referring domain.
Referring domains are very important, seeing as Google determines the quality of your backlinks by checking the referring domains as well. In practice, this means that Google prefers the number of backlinks and the number of referring domains not to have an enormous gap, otherwise it will view these backlinks as paid. And Google hates that.
What is a good number of Referring Domains?
How many can you handle? Double that! And that! And the more you have, the more you need!
54. URL rating
What is URL rating (UR)?
The UR metric measures the quality of the backlink profile of a URL.
More specifically:
The URL rating is measured on a scale from 1 to 100, like the Domain Rating. You should keep in mind that the higher the UR, the more difficult it is to rank even higher. For example, it’s easier to get your ranking from 30 to 40, but it’s very hard to go from 70 to 80.
Another thing you should take into account is the fact that for this rating, only do-follow backlinks count (for more details, just keep reading!). The main thing you should keep in mind though is that if a URL has high-quality backlinks, its UR score will be high as well.
What is a good URL rating?
In general terms, the higher your UR, the better.
55. Backlinks
What is a backlink?
A backlink is a link that links back to your own website.
More specifically:
This number refers to the required number of other blogs, pages, websites linking back to your content in order for you to make it to page 1 of your focus keyword.
The higher the number of backlinks required, the less desirable that keyword is. However, if your content is unique, you can always achieve many backlinks without even having to manually reach out to them.
The reason why backlinks are so important is one that we mentioned before: The more quality pages linking back to your own, the better. Google considers this to be a “vote of confidence” since a quality website trusts your own enough to link back to it. And since a quality page trusts your page, Google believes that it should be more visible to more people, resulting in higher rankings on an SERP (or Search Engine Page Result).
What is a good backlink rate?
Since we’re talking about a number and not a rate calculated by a formula, there is no specific answer. But based on the general rule of the thumb, the more quality (can’t stress that enough) backlinks you have, the better for you.
56. Organic Traffic
What is Organic Traffic?
Organic traffic is used to describe the number of visitors that end up on your page through a search result and not a paid ad.
More specifically:
Organic traffic is the opposite of paid traffic, where people click on an ad and, as a result, visit your page. The visitors that make up the organic traffic are the ones that used a search engine and ended up on your page as a result.
It is also different from referral traffic, as no page referred yours through a hyperlink, but the user took the time to search for a keyword that had to do with your content. So, content is important in that case as well.
What is a good organic traffic rate?
The more, the better the chances to convert, the merrier!
57. Keyword Search Volume

What is keyword search volume?
The keyword search volume is the number of searches conducted for a keyword over a specific timeframe.
More specifically:
The number of times people have conducted a search for either the keyword or a variation of the keyword over a 12-month period is what determines the search volume of the keyword. As expected, the numbers are determined on average. How many people are currently searching for what you are writing about?
Your location and search network settings play a role in determining what a good average keyword search volume is.
What is a good keyword search volume rate?
As with everything else, it’s not like there’s a definite number. The higher the search volume, the more potential there is in your article or content you are creating. You’ll need anything over 100 though.
58. Organic Keywords
What is an organic keyword?
An organic keyword is a keyword used for free traffic to a website.
More specifically:
It’s crucial that marketers know their SEO for that one, seeing as on-page keyword optimization is a key factor here. It’s highly unlikely for your content to rank on the first or second page of Google if the keywords you need are nowhere to be found in your copy.
Of course, you’ll need to use some tools to make this work.
What is a good organic keywords rate?
Oh well… Use as many as you can in your content, you’ll be good!
Marketing Metrics for PPC-Pay Per Click Ads
Number of Clicks | Click-Through Rate (CTR) | Quality Score | Cost Per Click | Cost Per Acquisition (CPA) | Conversion Rate | Impressions | Average Ad Position | Return on Ad Spend (ROAS) | Cost Per Mille (CPM) | Advertising Cost of Sales (ACoS) | Average Page Views per Visit | Assisted Conversions
Have you noticed some ads on top of Google’s search results? If you click on them, the advertiser pays a publisher a small fee, hence the name “Pay Per Click”.
PPC ads are a very good way to target effectively and reach consumers while paying a set price to the publisher and then the aforementioned small fee. This fee can be returned in the form of income if the ads are placed correctly and the targeting is on point. If not, it can cause your marketing budget to blow up. But let’s break this down a bit.
59. Number of Clicks
What are the clicks?
Probably the most important metric on this list. How many times did someone click on your ad?
More specifically:
Clicks are the metric around which everything is built when it comes to PPC ads. It’s about the number of people who clicked on your ad and this metric is usually the one that determines which ads perform and which don’t.
However, this is to be taken with a grain of salt, seeing as conversions are to be monitored as well when it comes to PPC ads, as clicks are directly related to that.
What is a good clicks rate?
There are a number of variables to take into account when trying to determine that. So, just keep reading!
60. Click-Through Rate (CTR)

What is Click-Through Rate (CTR)?
Click-through rate (CTR) is the ad clicks-to-impressions ratio.
More specifically:
In order to determine that number, a marketer has to have some other data collected and under control. Without the total number of clicks and the total number of impressions, there is no way to determine that number,
A high CTR means that you’ve done a good job, as it will mean that you’ve nailed your keywords and your ads seem to be informative and enticing enough for a prospect to click on them.
What is a good CTR?
How high or low a CTR is, is industry-specific. However, according to Google Ads, anything over 2% is above average.
61. Quality Score
What is Quality Score?
Quality score is Google’s ranking of how relevant your PPC ad campaign is and how successful your campaign’s content is.
More specifically:
Quality score is an absolute number on a scale of 1 to 10, with 1 being the lowest and 10 the highest and you can use it to determine the quality of your keywords, wherever they may be used, from an ad to a landing page. The higher the quality of your ad, the lower the Cost Per Click, the better the ranking of your ad.
If you access your keywords’ report and check the “Status” column, you will see not only the quality score, but also its components.
What is a good Quality Score?
It’s an absolute number from 1 to 10, as mentioned above. So the best guess would be that you need more than a 5 to say you’re above average.
62. Cost Per Click

Cost per click (CPC) is the amount of money that an advertiser pays for each of their ad(s).
You can easily find the CPC of an ad by dividing the total cost of your campaign with the number of clicks it received.
What is Cost Per Click?
Cost Per Click is how much each ad costs, more or less.
More specifically:
Cost-Per-Click bidding is the amount of money each of your clicks will cost you. The process is the following: A marketer sets a maximum bid for cost-per-click, creates the campaign, and then the clicks on the ad determine the price the publisher will pay for each click.
This amount will most probably be lower than the maximum amount you’ve set for the campaign and you’ll be able to see the exact amount if you divide the total end cost with the number of total clicks over an amount of time.
What is a good CPC rate?
It depends, again, on the industry’s standards.
Something you’ll need to keep in mind when it comes to CPC:
There is an Average Cost Per Click rate. There is not an essential difference between the two, however, you’ll need to remember that the Average CPC takes the total cost of the total clicks into account.
63. Cost Per Acquisition (CPA)

What is Cost Per Acquisition (CPA)?
Cost per acquisition is the actual cost to an advertiser when he acquires a customer.
More specifically:
Concerning PPC, this is the cost the advertiser spends on ads and campaigns to acquire a customer and is calculated by dividing the total spent on PPC Campaigns by the actual number of the customers acquired.
For example, if you spent $5000 to acquire 10 customers, your CPA will be $500 or $500 for each customer.
What is a good CPA rate?
As with most of the above, this depends on your industry and as with CPC, it needs to be as low as possible in order to be sustainable.
64. Conversion Rate
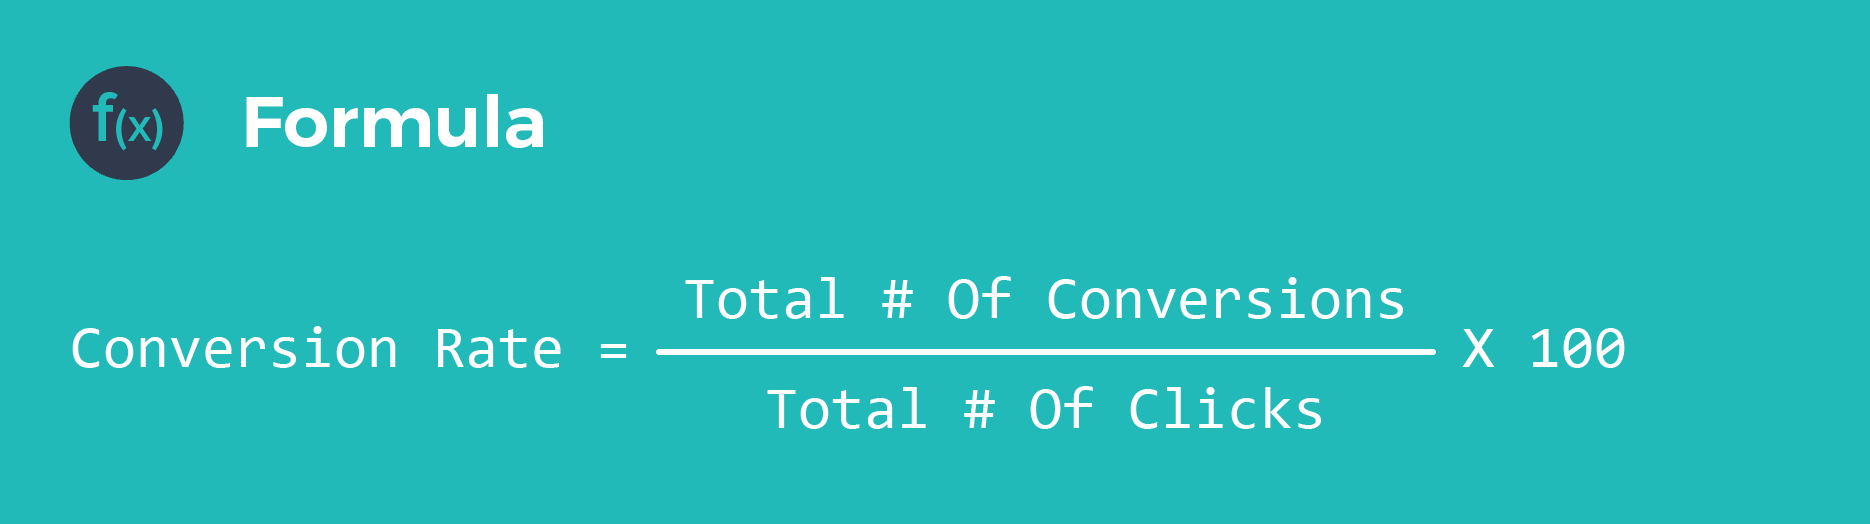
What is the Conversion Rate?
The conversion rate is the average number of visitors (or clicks) converting into leads or customers.
More specifically:
The conversion rate is essentially the metric that determines the success of your campaign, seeing as this metric is used to let you know how many leads converted into customers. Let say, your e-commerce website gets 100 clicks in a week, and you get 20 sales from them, your conversion rate will be 20%.
What is a good conversion rate?
Ideally, you’d want to have a conversion rate of 10% or higher. However, this is a general rule of thumb.
65. Impressions
What is “Impressions”?
This metric is used to describe how many times a person views your ad.
More specifically:
It’s where advertising begins, more or less. Impressions don’t really take the relevancy or the CTR of the ad into account. It’s more about how many people your ad has reached. If you are a marketer who aims to get the best of brand awareness, this metric is what you need to be focusing on.
What is a good impressions rate?
There is no general rule here, but you’ll need to remember that impressions should generate leads and convert, down the line.
66. Average Ad Position
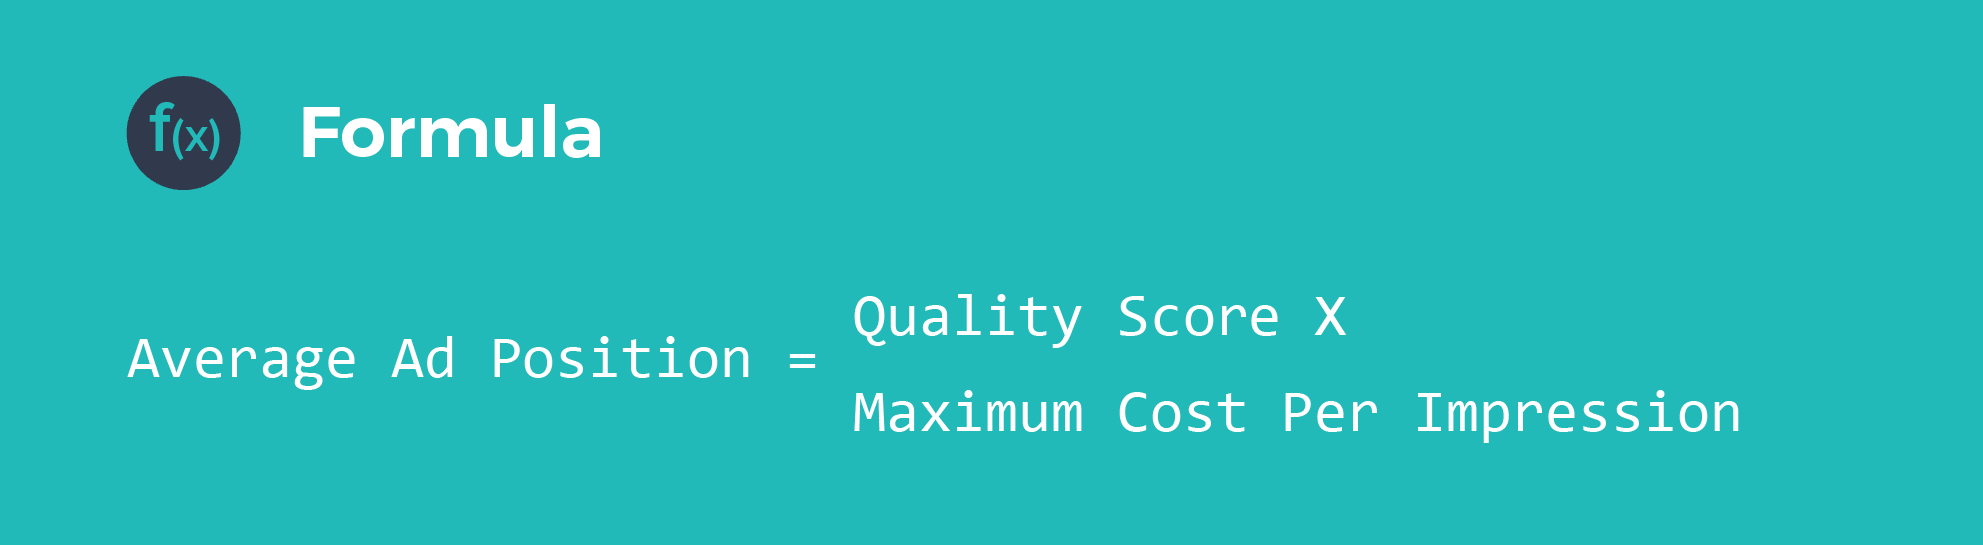
What is the Average Ad Position in PPC?
The Average Ad Position determines your rank amongst other ads on search results.
More specifically:
This is not an organic metric and is calculated by multiplying the quality score of your ad with its maximum cost per impression. Keep in mind that you cannot get to the first position by merely increasing your bid because the quality score has equal weight when it comes to deciding which ad will be on top of all.
As you understand, your average position may determine your rank, but it’s not absolute in the sense that it won’t show you your exact position on the SERP.
What is a good average ad position?
On average, you need a position between 1 and 4, as these positions are the ones shown on the first page.
Update: Google has decided to sunset this metric as of September 2019.
67. Return on Ad Spend (ROAS)

What is ROAS?
It’s the metric used to describe the quantity of revenue a business gets after spending a specific budget on ad campaigns.
More specifically:
In order to get that number, all you have to do is divide the revenue of the ad by the money spent on that ad. Essentially, this metric calculates how much of the money you spent on an ad came back to you in the form of profit.
For example, let’s assume that your e-commerce business generates revenue of $10,000 after spending a budget of $2000. Divide revenue by budget spent and you’ll have a return on ad spend which will be 500%.
What is a good ROAS rate?
The more return you get on your ads, the more successful your ad campaigns are.
68. Cost Per Mille / Cost per thousands of impressions (CPM)
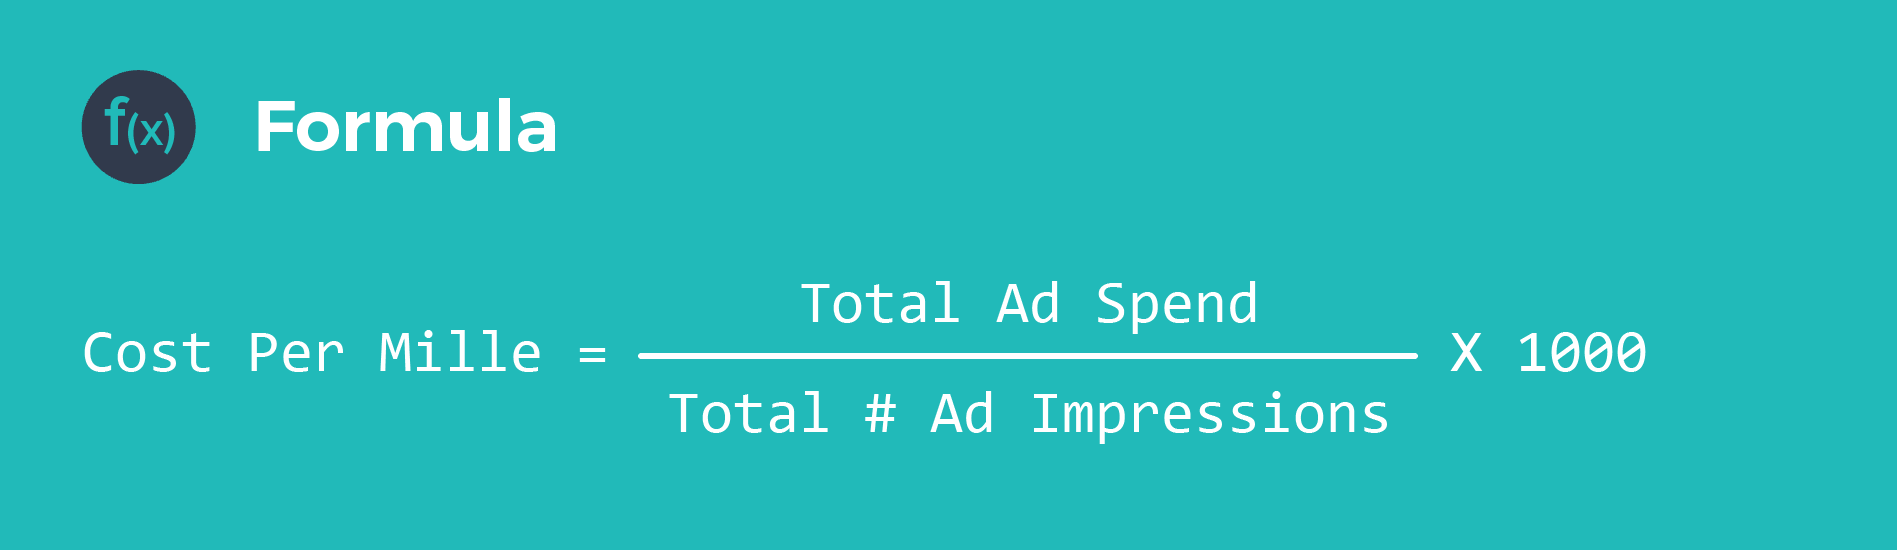
Cost Per Mille or Cost Per Thousands Of Impressions is one of the various pricing models of the PPC game. The advertiser sets a fixed price for 1,000 impressions on their page. It’s the most common model. Keep in mind that for this model, the advertiser needs to pay for every single impression, whether it leads to a click or not.
This is what differentiates CPM from CPC, which is the model by which an advertiser is charged per click on an ad shown.
They are suitable for branding and exposure activities, as the overall cost of a thousand impressions is significantly lower than the same amount of clicks.
What is a good CPM rate?
This is something you’ll need to check industry-wise, as there is no set amount for that.
69. Average Order Value

What is the Average Order Value?
The average order value is the revenue-to-amount of orders ratio.
More specifically:
The Average Order Value is calculated by dividing the revenue of all customers acquired through your paid campaigns by the number of orders. You need it as a marketer because it will help you understand the buying behavior of incoming customers from PPC.
Let me give you an example: Let’s assume that you’ve got an eCommerce store and its sales were equal to $500 for a total of 10 orders. Your AOV, in that case, will be $50. So, if you measure this metric on a monthly basis, it’s $50 for that month.
What is a good AOV rate?
The average order value is only one of the things you should keep in mind when it comes to orders, specifically. If you need more insight on that matter, go ahead and check this out!
70. Advertising Cost of Sales (ACoS)

What is Advertising Cost of Sales (ACoS)?
ACoS is the average percentage of ad costs in acquiring a sale.
More specifically:
You can measure Advertising Cost of Sales by dividing the total sum of money spent on ads by the total sales for that campaign and multiplying by one hundred in order to get the percentage. Assuming that you spend $5 on your store, and you get a sale of $250, your ACoS will be 2%.
This is one of the lesser-known PPC metrics, seeing as it’s more widely used by Amazon. ACoS can make or break an ad campaign, as a metric, but you’ll need to combine it with other metrics first. However, this metric can help in a variety of ways, the most important of which would be that it can improve your Best Seller Rank. This can bring you more sales.
What is a good ACoS rate?
Low ACoS means high profit. But an ACoS that is too low would mean low visibility. As with everything, this depends on the industry, however, a percentage of 15-20% on average should be fine.
71. Cost Per Lead (CPL)
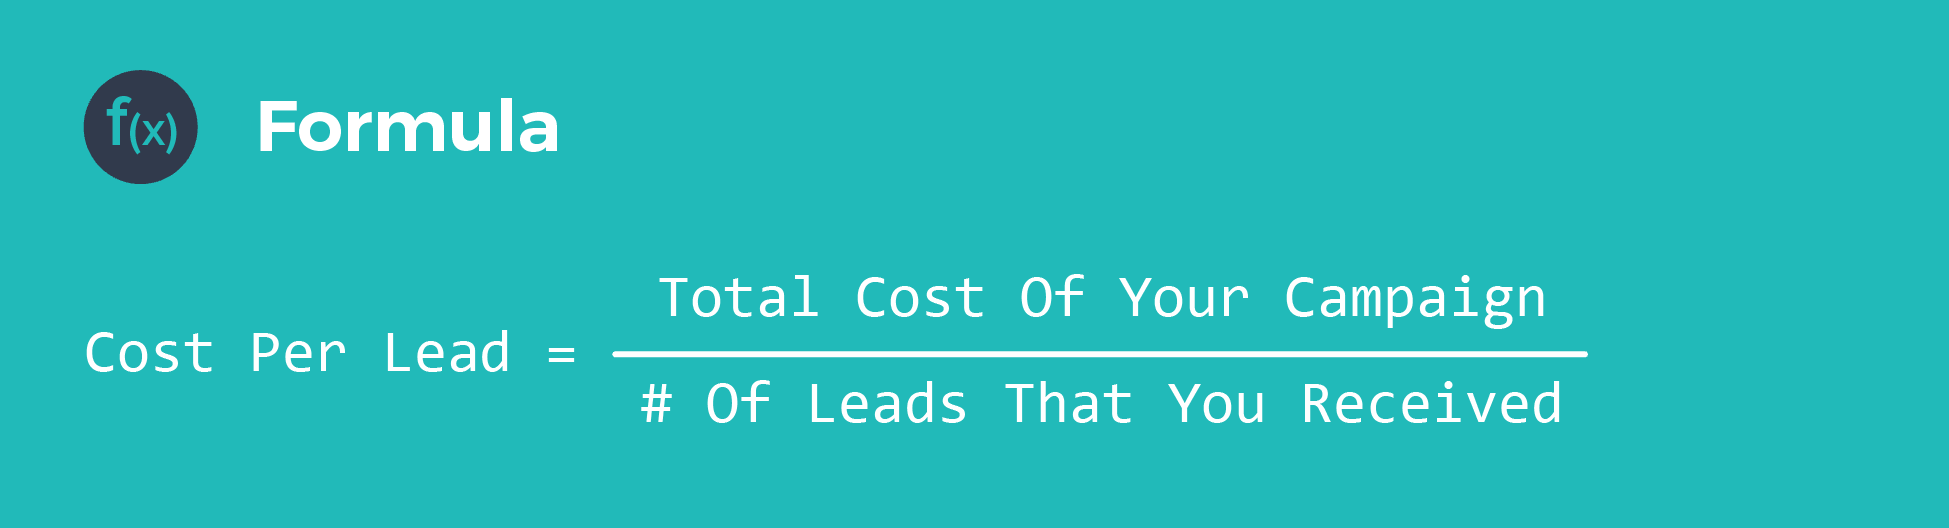
What is Cost Per Lead (CPL)?
The CPL metric calculates how much an advertiser pays for a new lead.
More specifically:
Cost Per Lead sounds a lot like Cost Per Acquisition (CPA). It measures the average cost of acquiring a lead as well. However, CPL focuses on engaging customers, whereas CPA is a “one-stop-shop”, all the way to the transaction and credit card details.
CPL is measured by dividing the cost required to generate the leads by the number of leads received. So, if a campaign cost $500 and it generated 20 leads, the CPL would be $25.
This metric helps you understand the amount of budget you spend on getting a single lead.
What is a good CPL?
As with all metrics, there is no one-size-fits-all rule. However, you’ll need to remember that if your gross profit is X, your CPL will need to be lower than that.
72. Average Page Views per Visit

What is Average Page Views per Visit?
The average page views per visit is the number you’ll get if you divide the total number of page views by the total number of visits during a specific timeframe.
More specifically:
This metric is used to measure how many pages a visitor decided to visit in one session when it comes to your website. The total number can be an indicator for a number of things, such as the bounce rate and how relevant or useful your content is.
It can also indicate some technical issues, such as a website that is difficult to load and, therefore, has a high bounce rate.
What is a good Average Page Views per Visit rate?
You should check your industry’s average, in order to answer that question.
73. Assisted Conversions
What is “Assisted Conversions”?
This metric calculates the period of time between an impression and a conversion.
More specifically:
View-through or Assisted conversions are the conversions that occurred after an impression. The key here is that the prospect turned into a customer, not by clicking your ad but by later visiting your website or finding your offer/product organically and converting.
For example, let’s say that you saw an ad for shoes. You may not click on it or get redirected to a landing page straight away, but look up the brand a day or two later and buy the pair. This purchase will add a +1 to the Assisted Conversions tab of said brand’s metrics.
What is a good assisted conversions rate?
Again, there is no one-size-fits-all amount.

Back to you!
We could go on and on and come up with more marketing metrics and more definitions, best practices… You name it! But hopefully, this article helped you nail down the basics.
So, what do you think? Did we do a good job? Is there anything you’d like to ask, add, or anything that got you thinking or wondering?
Which marketing metric is your favorite?
Leave us a comment and share the knowledge with your favorite marketer!
Similar Posts


Create, send and optimize your email marketing campaigns!